 |
Weather Reports 2008/9 |
 |
 |
|
|
Weather Reports 2008/9 |
|
|
|
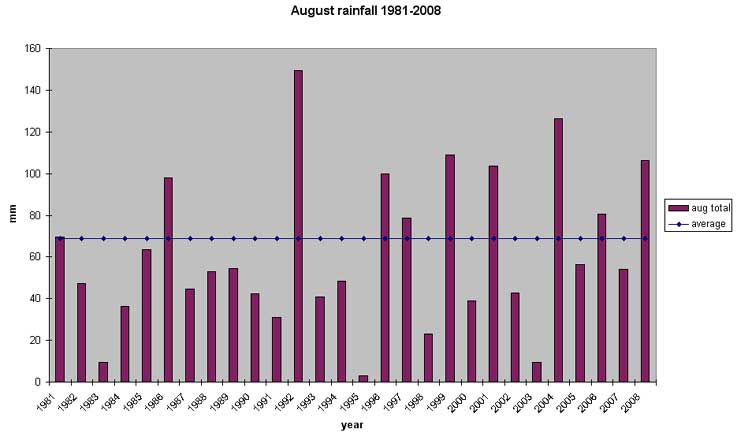
| Was August 2008 really the wettest you can
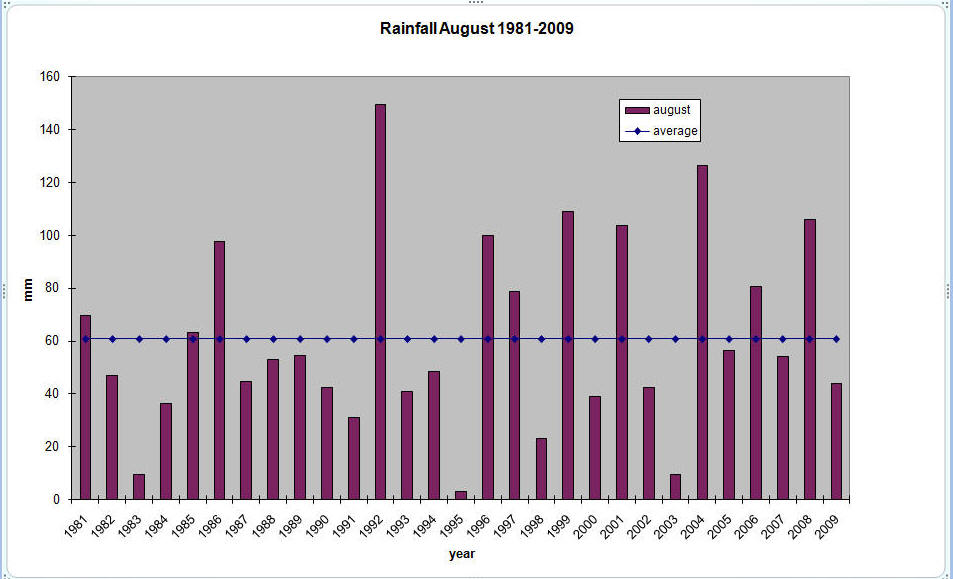
remember - Gary Beynon puts it all in perspective .... AUGUST 2008 How well do you remember the weather from one year to the next ? I suspect we all remember the extremes and in our minds these quickly become the pattern for a particular period of time. What about August 2007 compared with 2008 or indeed other "wet" years ? Here are the facts.
Conclusion: 2008 wasn’t as bad as it might have been ! The rainfall for the last 27 years in August is shown below. As you can see the average over 27 years is 69 mm so 2008 was well above average but by no means the highest. I hope to keep you updated on a monthly basis. These figures are from my amateur weather station in Hyde Heath and unfortunately the set up does not meet the very stringent criteria set by the Met Office but are nevertheless very good indicators and comparisons.
Gary Beynon
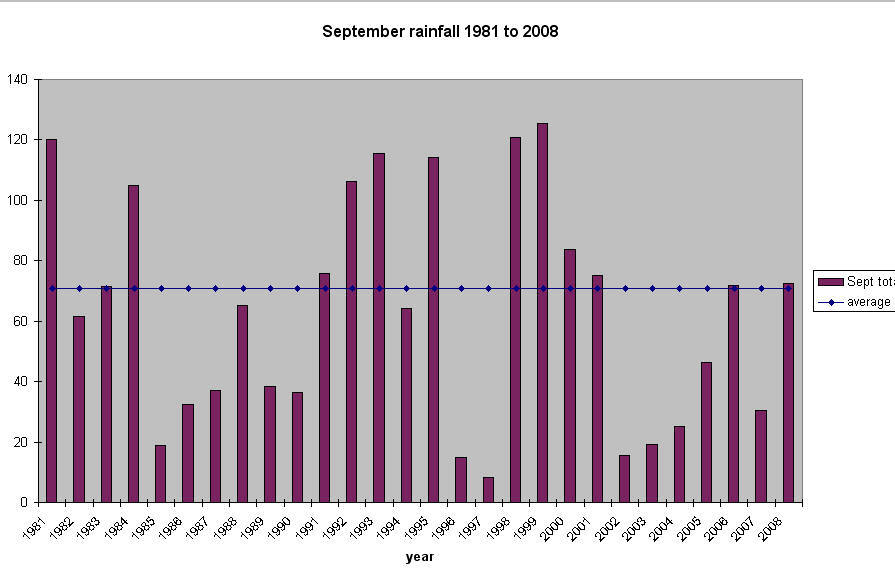
What a month
of contrasts! Wet at the start and then dry from mid month onwards. Didn’t feel
that warm though. Where was the Indian summer that we were promised? How did
September 2008 compare with other years?
Conclusion: 2008 was wetter, cooler and didn’t really come up to expectations ! The rainfall for the last 27 years in September is shown below. As you can see the average over 27 years is 70 mm so 2008 was very much on average but you can see the considerable variation that we have experienced.
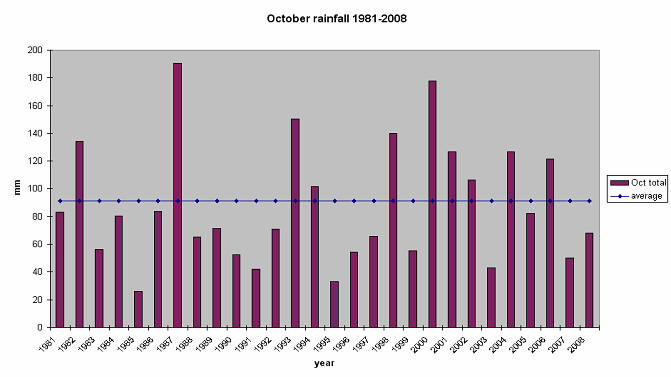
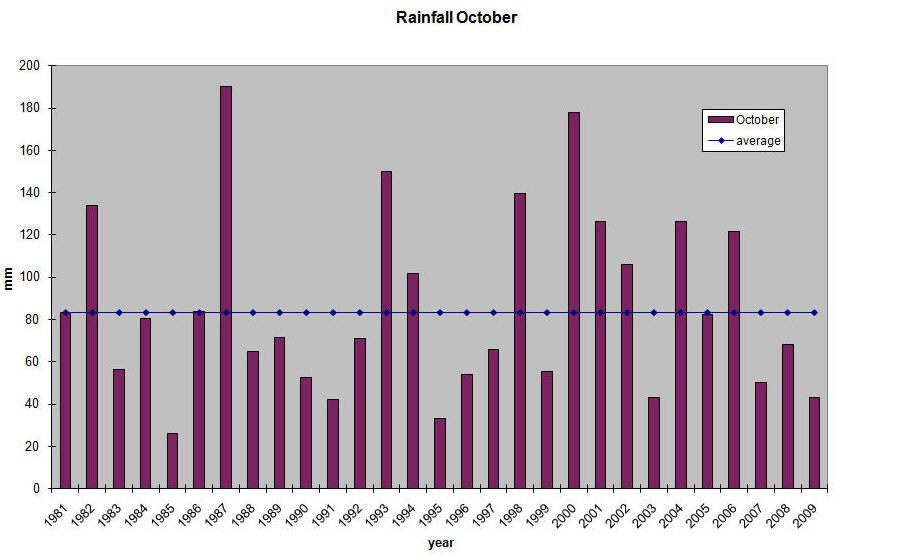
Gary Beynon Snow in October! Bit of a shock to the system and to the roads. I can’t find a reference in my records (going back to 1981) to snow this early in the year. Does anyone have anything before that? The Met Office have said that the last snow to fall in London was back in 1934 but things can be a little different in the wilds of the Chilterns. From the data below you will see that on average conditions were very similar to October last year.
Here are the facts :
The rainfall for the last 27 years in October is shown below. As you can see the average over 27 years is 91mm so 2008 was below average but you can see the considerable variation that we have experienced over the years.
Gary Beynon
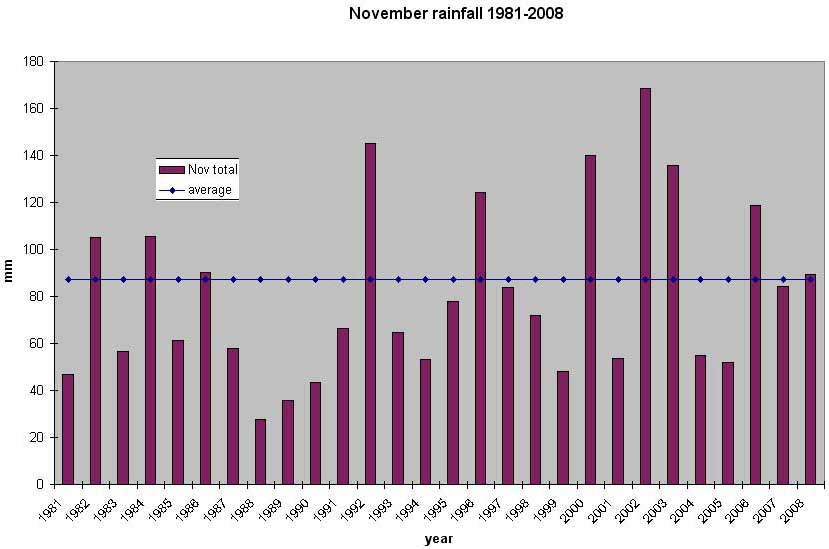
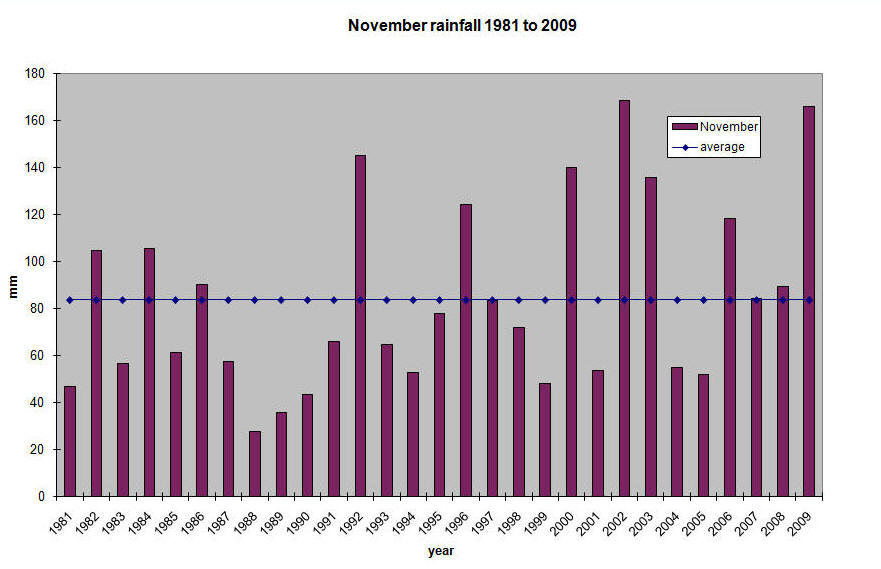
The weather is always a topic for conversation especially in the UK and even more so when there are extremes. What about November 2008? Pretty average as Novembers go but what is “average”? The rainfall was almost exactly on average but when you look at the variations over the years, to be on the average is purely coincidental. Maximum, minimum and mean temperatures were all very similar to last year. There were 22 days with recordable rainfall (16 in 2007). For me, the main characteristic of this November was that there were too many days when the sun didn’t appear. It was DULL!
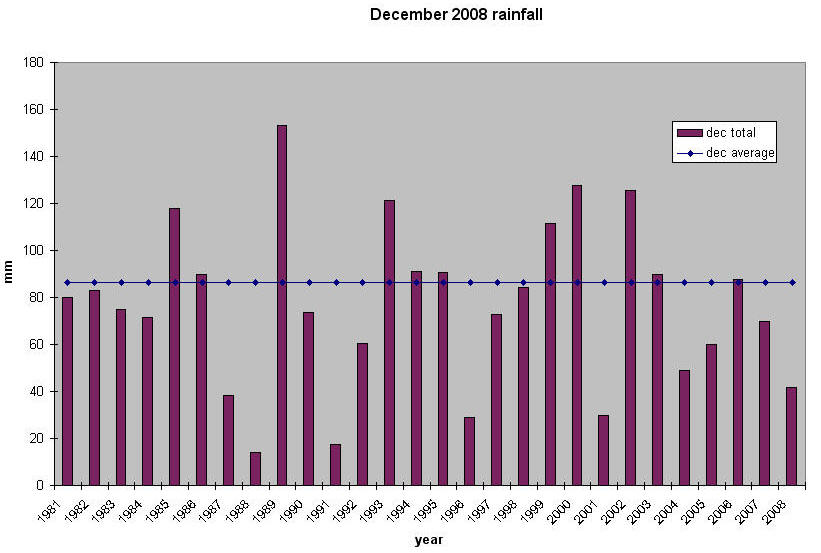
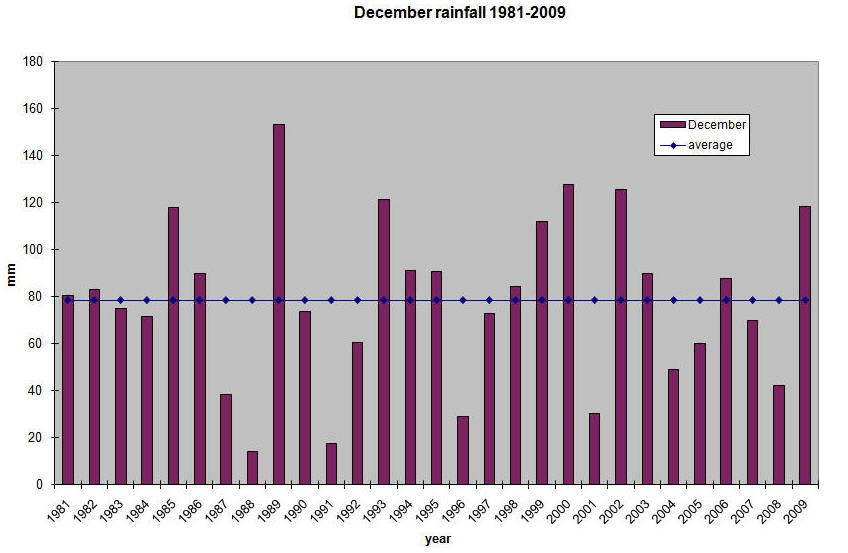
Gary Beynon Weather for December 2008 I wonder what we will remember about the weather in December 2008? It was actually a very variable month with 2 days reaching 12.6ºC and some minimum temperatures that were dramatically higher than the maximum ones we are currently experiencing. It was also a very dry month with 13 days at the end with just 1 day when I recorded “trace” for rainfall. (This is a time when you know that there has been precipitation but it is not measureable.) There was no snow but there were a lot of frosts that covered the cars with thick layers of ice. Here is the data with a comparison for 2007 :
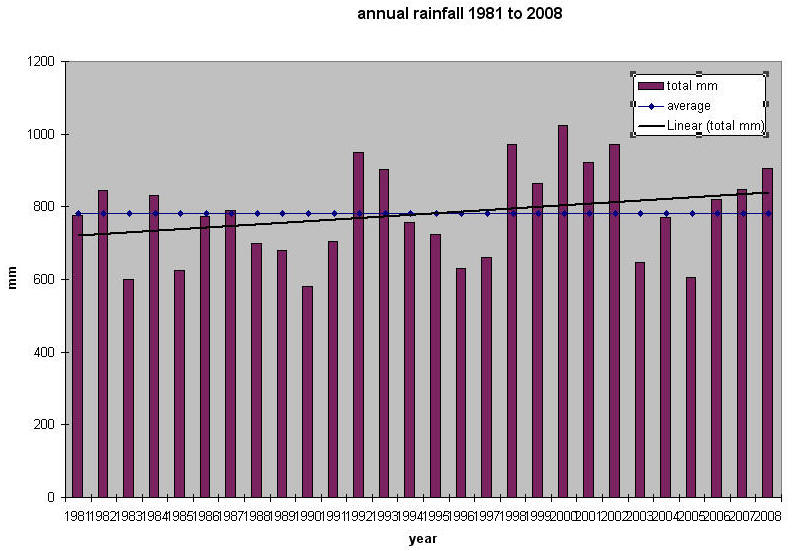
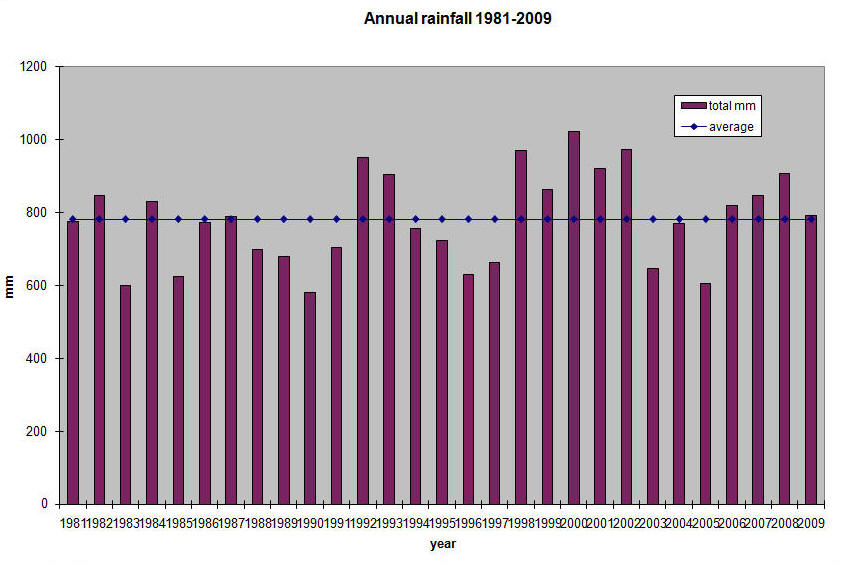
That brings us to the end of another year and I have included the annual rainfall for 2008 and the comparative figures (in graph form) since 1981. 906 mm in the year made it wetter than average but not the wettest that I have recorded. The “linear” line is a trend line over the years. It does show an increase but there is probably insufficient data for this to be statistically meaningful. The rainfall over the 6 winter months is a good indication of the amount of water reaching the water table. I will report on that at the start of April.
Gary Beynon JANUARY 2009 WEATHER Yet another month that goes a long way to prove that the UK weather can vary enormously over a very short period of time. Following 10 days with a frost overnight at the start of the month, and maximum temperatures of 4ºC but mostly at 2º or below, the temperature then jumped to 9ºC and remained ”high” for 21 days to the end of the month. There were many frosts at night however. Summer, or Spring at least, had not come and, as I write this the SNOW is falling heavily. I do not envy the poor weather forecaster; things are so variable and so unpredictable. The rainfall was just about dead on average but, look at the graph, the variation from one January to the next is quite dramatic.
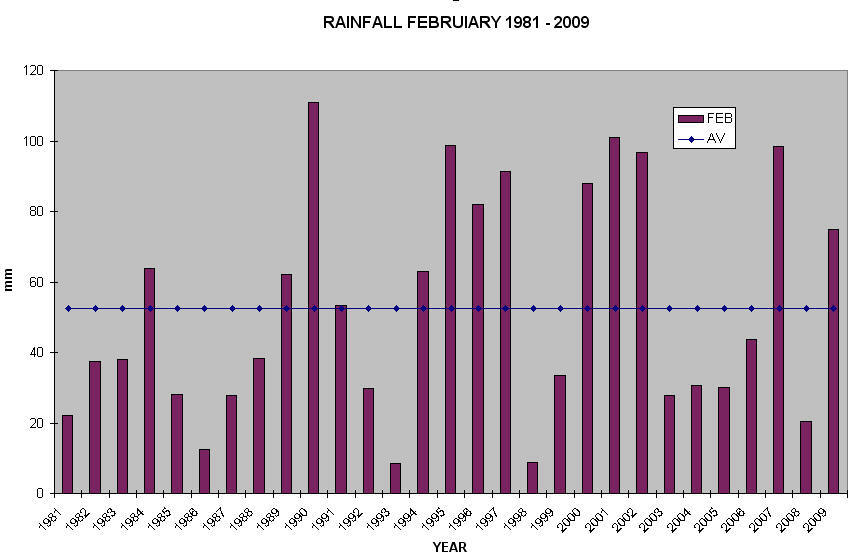
Gary Beynon FEBRUARY 2009 WEATHER Another month of contrasts. It started off cold and finished a good deal warmer; well all things are comparative and perhaps “less cold” would be a better description. But we did have snow and we didn’t cope with it. This is hardly surprising when you consider how little snow and how infrequently we have it in this part of the world. It is actually very difficult to translate a depth of snow into the equivalent rainfall. Even when you allow the snow in the gauge to melt, the amount can be so very dependant upon the type of snow (as the railways know!) and the way in which the wind swirls it about. A general rule of thumb is that 12 inches of snow depth is equivalent to 1 inch of rainfall. Bearing in mind that we had snow on 9 days in February, it is just as well that all the snow didn’t settle, that much was wet and therefore the depth didn’t accumulate. Here is the data.
The February rainfall chart is below.
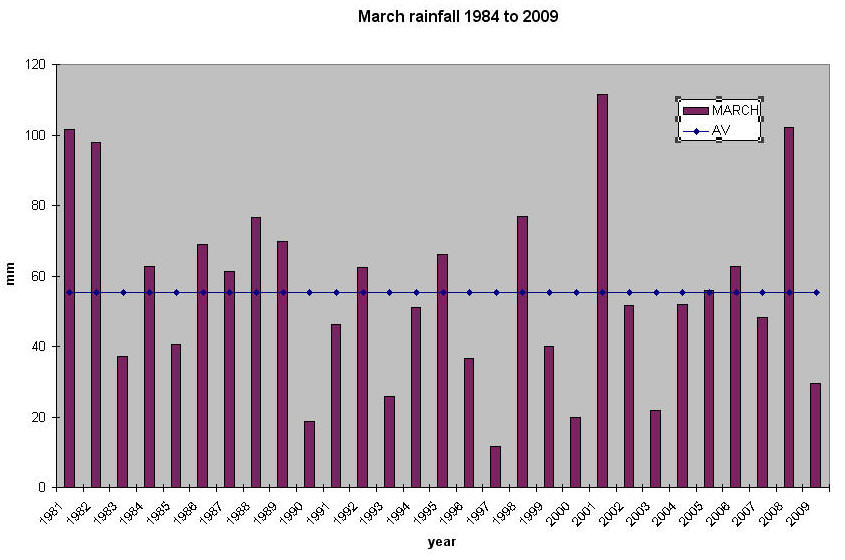
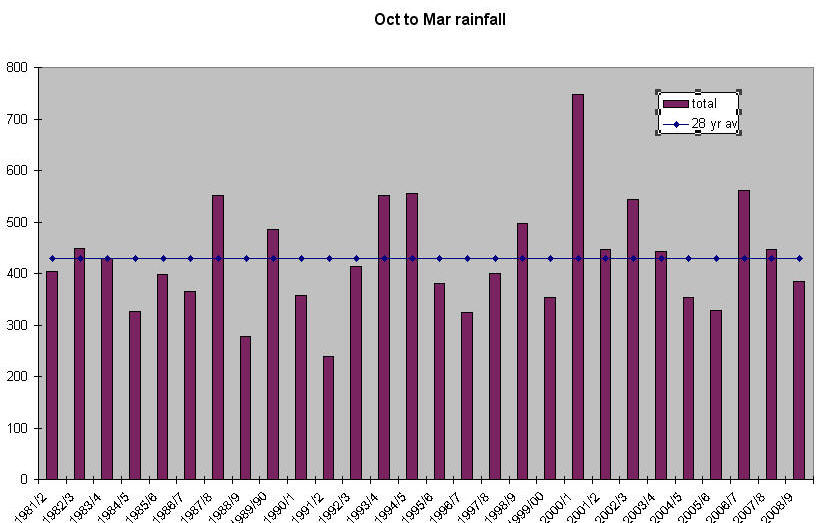
Gary Beynon MARCH 2009 WEATHER Yet another month of contrasts with rain to start and a very long dry period through the middle. It was actually a comparatively dry month with rainfall below average and nearly half the rainfall coming on one day. There were also many mornings when we woke to see frost on the cars but fortunately, as the roads were generally dry, there were none of the black ice problems we had in February. It was, I think, a very pleasant month with the daytime warmth bringing on the buds and getting things started in the garden. Certainly the farmers were pleased at the dry spell that has allowed them to plough, harrow and drill all in the space of less than two weeks. No doubt they would now like some rain! We have now completed the 6 months that are important to the replenishment of the water table; most of the rain from now on will go back into the atmosphere through the plants and trees or by evaporation. I have included a graph to show the winter rainfall over the years. Hose pipe restrictions this year? Probably not----but don’t hold me to it!
March Rainfall below :
Winter Rainfall - October - March below:
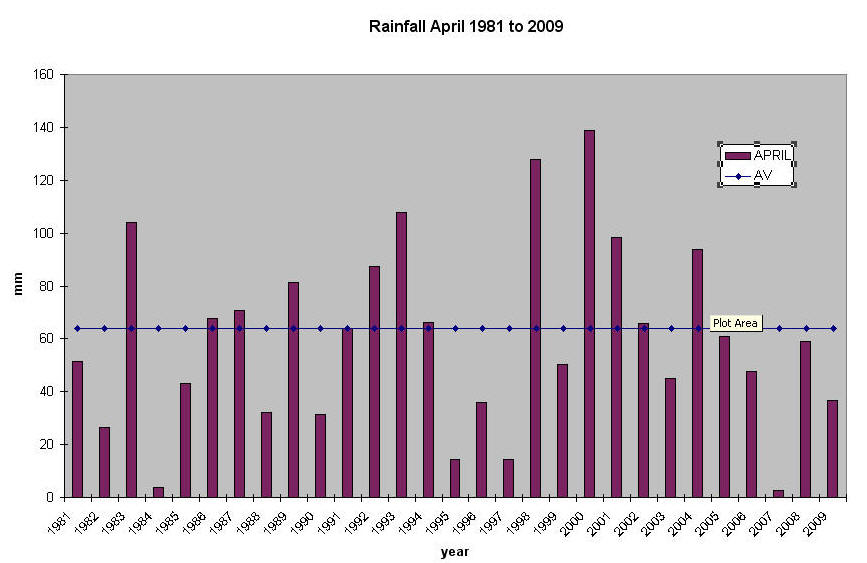
Gary Beynon HYDE HEATH WEATHER APRIL 2009 April was a dry month with quite a lot of sunshine and some not unreasonable temperatures. I suspect that the farmers were looking for rain by the end of the month as the spring crops weren’t doing a great deal. Driving over some of the farm tracks up at Shardeloes sent a cloud of dust up which is not really what one expects at this time of the year. The Misbourne however is quite full with water alongside the Link Road carpark in Great Missenden and both lakes in Lower Park full to the top. The temperature range was high with a maximum of 20ºC and a minimum of 2.4ºC, not that different from 2008. There is only one aspect of our British weather that we can rely on---it is very variable and constantly surprises!
April rainfall since 1981 is shown below.
Gary Beynon
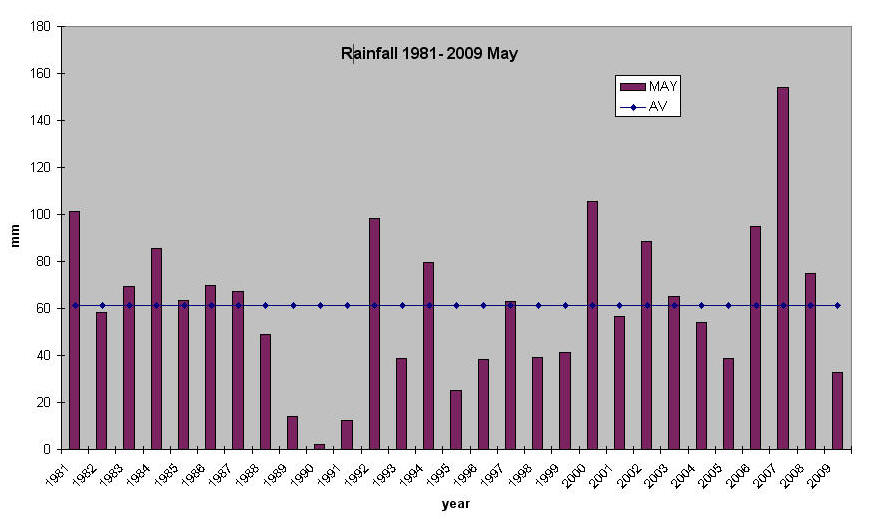
Hyde Heath Weather May 2009 May is now the third consecutive month of low rainfall especially when compared with last year. March, April and May have only seen 98.8 mm compared with 241.1 mm in the same period in 2008. I suspect that we all realise this when you consider just how hard the ground is and the somewhat slow growth of the Spring crops in the fields. Apart from the rainfall, May across the 2 years show some very similar statistics on average. What is a little different is the pattern between the years. In 2008 it was the first two weeks of May that saw temperatures reaching 26ºC whereas we had to wait until the very end of the month this year before seeing something similar. The rainfall pattern was the same; in 2008 most of the rain came in the last 7 days whereas this year, what there was, came mostly on Thursday 14th. Nothing is predictable is it?
The rainfall graph for May over the past years is shown below.
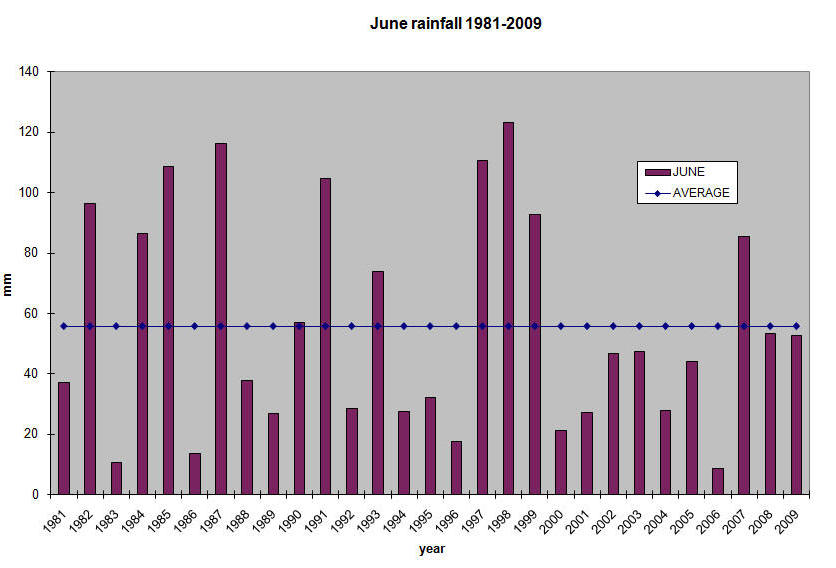
Gary Beynon Hyde Heath Weather June 2009 This June certainly had something about it that will keep it in our memories for a short time at least. I refer of course to the high temperatures of the last 6 days. Is there a point where we notice the higher temperature or is it dependant upon what has already going on ? Can we become used to something different? I suspect that we do become acclimatised to temperature, we can get used to higher temperatures but those in the upper 20s take some getting used to especially in this country where the humidity tends to be quite high. (It has nothing to do with the fact that once abroad in high temperatures—and lower humidity—there is often the sea or a pool; or has it ! ? ). June 2009 compared with 2008 shows actually a very consistent picture. Rainfall, mean temperatures, lowest temperature were all very consistent; just that surge up to 29.7ºC on the 29th that stands out.
The rainfall data all looks very average but as you can see
from the graph below, there have been some very wet June months in the past.
Gary Beynon
Hyde Heath Weather - JULY 2009
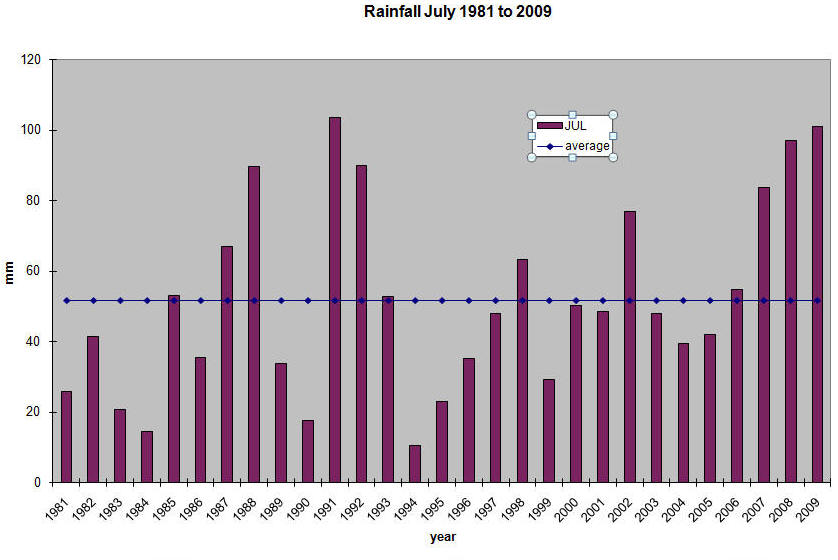
July was hardly a month that we will want to remember! Best described as wet and not a great deal else to commend it. Purely on the figures alone, it was actually not much different from July in either 2008 or 2007. But figures don’t always show the full picture. Rainfall wise all 3 years were wet but the difference was in the number of days when rain fell and its intensity. Temperature wise there was not a lot to choose between them. In 2009 the best part of the month was when we were away; it just got worse from then on. What of August ? I thought that if I left this report long enough, I could “forecast” August’s weather. I am not that brave---or stupid!
Gary Beynon
AUGUST 2009 WEATHER This last
August was at least better than August 2008; but that’s not saying a great deal!
It was drier, the maximum temperatures were higher but it was still
disappointing and hardly came up to what we were promised/predicted some months
back. On 17 of the days I have recorded rather a lot of cloud. Still if you can
remember back to the 1950s---and some of us can---summers then also seemed to be
wet. I have vivid memories of holidays in Paignton listening to the rain pouring
down and coming home early because it was
Gary Beynon
SEPTEMBER 2009 WEATHER
I have been looking to see what the official definition of a drought is from the Met. Office. Can’t find it! I do remember that it is a certain number of days without measurable rain. How many days? Forgotten! However, September this year must have come pretty close to the official definition. It rained on 3rd and there was nothing of real note then until 1st October. True that there were 3 days around the middle of the month with rain but it only amounted to a total of 1.2mm. You only need to look at the way that the grass hardly grew, the brown patches started to appear and the areas under the trees showed no signs of moisture at all. It was the driest September for 12 years. Add it all of that the warm temperatures and it was a rather pleasant month. Certainly better than average and a big improvement on 2008 and the earlier parts of our summer. Here are the facts:-
* of this 17.1 mm 15.9 mm fell in the first 3 days of the month * * ie anything measurable including ”trace” where you can’t measure it but there was some, albeit minimal, precipitation
Gary Beynon October 2009 weather
As I write this report (14th November) we have just had 2 days of rainfall that, at 42.1mm, very nearly equals the total rainfall in October of this year of 43.3mm. The one fact that you can forecast about the weather is that it will be unpredictable! October was a quiet month; there really was nothing extreme about it. It rained but there was not a great deal, the temperatures were pleasant with no frosts and the garden showed the effects by things not dying back and indeed we picked runner beans well into the month. I felt that the autumn colours were quite something; such a variation and we were so lucky that they lasted for a long time. The lack of rain left the ground hard and, may I remind you that it is the 6 months from October to March that we rely on to fill up the aquifers. This period has not started well (but November is making up ground fast!).October last year was special in that it snowed on the 28th . The actual data is below with some comparisons from the past.
The October rainfall graph is shown below.
Gary Beynon NOVEMBER 2009 WEATHER
November was wet! I doubt anyone will disagree with that statement; but compared with Cumbria we escaped very lightly. It was not the wettest month I have recorded since I started to keep the data in 1981 but it is well up the leader board. The wettest I have was in October 1987 when we had 190.4 mm and the wettest November was 2002 at 168.5 mm. What is perhaps more unusual was that there was a recordable amount of rain every day of the month. (Recordable in weather terminology means something less than 0.1mm and is recorded as “trace”.) In fact there has been rain since October 30th. 32 days of rain; little wonder that the ground is wet but the lake opposite the Chiltern Hospital is well down, presumably due to water extraction by Veola. Other than the rainfall it was not a particularly remarkable month. It was really rather mild with 2 air frosts and just the 1 day of a minus temperature (early this morning the 1st December----yes December but I record the data at 0800 hrs each day and it refers to the previous day which is standard practice). The facts and figures
The rainfall chart for November 1981 to 2009 is shown below.
Gary Beynon
DECEMBER 2009 WEATHER REPORT Do I dare talk about the weather after what we have been experiencing during the last week or so? If you don’t want to know the result, please turn off the volume and close your eyes now. Return round about June when-hopefully-the weather will be a deal more pleasant. It was wet, it was cold, we had snow before Christmas and all in all there was little to recommend December. Chris asked if I could look at the records to see if the winters were getting snowier; I am part way through compiling the data. My recommendations for snow chains or hibernation will appear shortly. Compared with 2008, this last December was a lot wetter but average temperatures were similar. The rainfall over the full year was less than the previous 4 years but very close to the average for the last 28 years.
The rainfall graphs are shown below.
Gary Beynon
|
|||||||||||||||||||||||||||||||||||||||||||||||||||||||||||||||||||||||||||||||||||||||||||||||||||||||||||||||||||||||||||||||||||||||||||||||||||||||||||||||||||||||||||||||||||||||||||||||||||||||||||||||||||||||||||||||||||||||||||||||||||||||||||||||||||||||||||||||||||||||||||||||||||||||||||||||||||||||||||||||||||||||||||||||||||||||||||||||||||||||||||||||||||||||||||||||||||||||||||||||||||||||||||||||||||||||||||||||||||||||||||||||||||||||||||||||||||||||||||||||||||||||||||||||||||||||||||||||||||||||||||||||||||||||||||||||||||||||||||||||||||||||||||||||||||||||||||||||||||||||||||||||||||||||||||||||||||||||||||||||||||||||||||||||||||||||||||||||||||||||||||||||||||||||||||||||||||||||||||||||||||||||||||||||||||||