 |
Weather 2010 |
 |
 |
|
|
Weather 2010 |
|
|
|
Weather reports by Gary Beynon based on his own observations & measurements
|
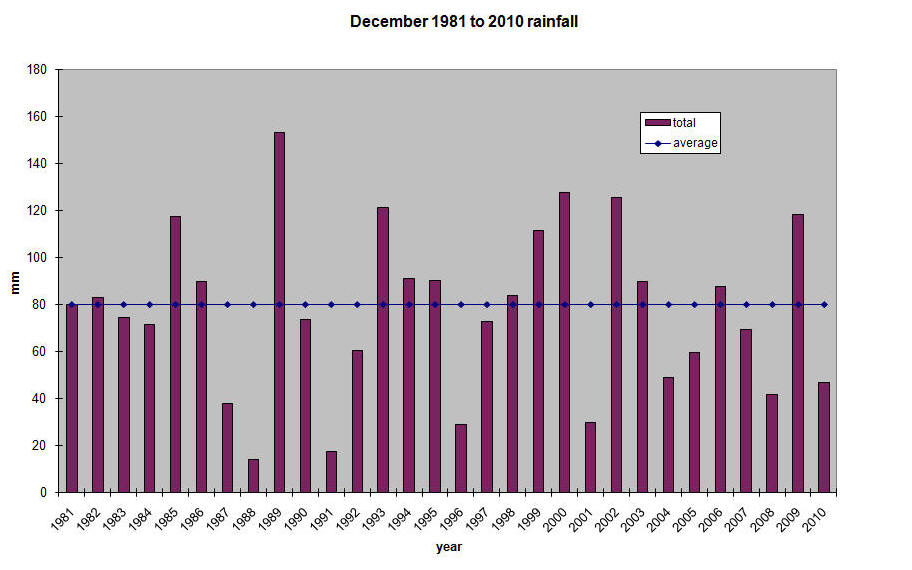
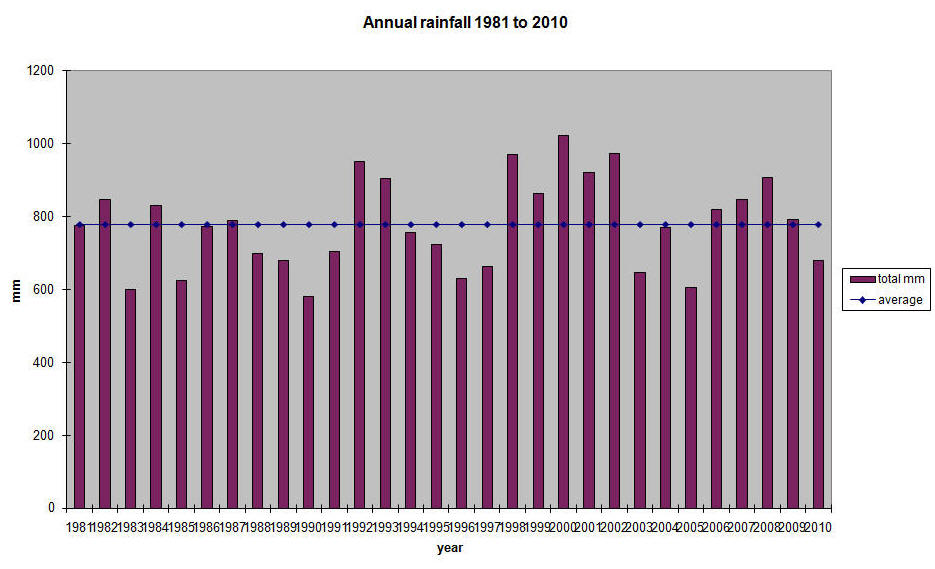
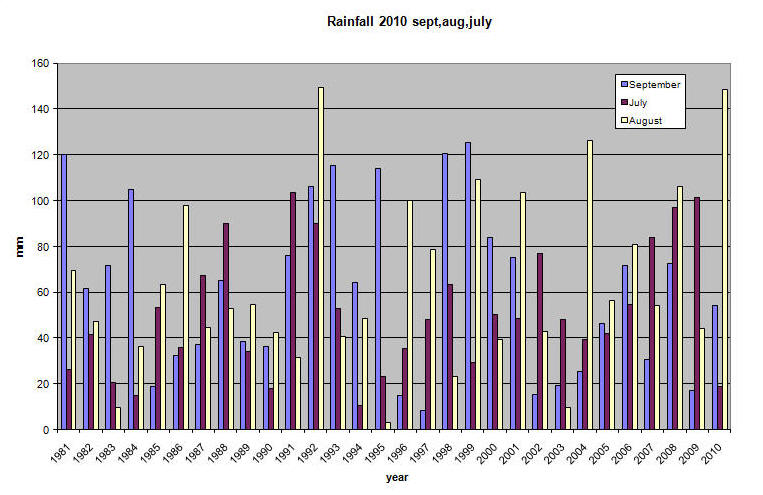
Data for December 2010 And Some annual comparisons I suspect that most of us are glad to see the back of December. It was cold, dismal and had a deal of disruptive snow. There were some very low temperatures recorded in this area; Chesham was -19ºC one night (think that’s right). The minimum in Hyde Heath that night was a mere -8.3ºC. You might ask why the great difference over such a short distance; Chesham is a notorious frost hollow being a continuation of the Rickmansworth hollow so one would expect the temperatures there to be lower than up here on the hill, and my temperature sensor is mounted on the back north wall of the house and could read just a little higher with the house effect. Have you noticed that there is generally a 2º difference in temperature as you drive up Frith Hill from Great Missenden (it gets warmer as you come up to the Barley Mow)? There is an advantage of living on a hill after all! It is very difficult to measure the rainfall equivalent of snowfall especially when the temperatures remain cold enough to keep the gauge frozen for days on end. I measured 27 mm of snow precipitation when the gauge thawed; the snow depth was approximately 20 cm with a bit of sleet and other snow accumulations. The 27 mm and the depths are in quite close agreement. It was a dry December compared with other years but we saw little sun and had quite a lot of fog and mist. You can see from the year’s monthly rainfall chart that August was by far and away the wettest month but overall the rainfall has not been that high. April to July was dry; August made up for the dry spell. I wonder what we will remember about 2010 weather wise? The wet August, the snow in December, the warm June and July or the days we went out and the weather was either great or dreadful?
Gary Beynon Top of Page Home Weather Reports 2009
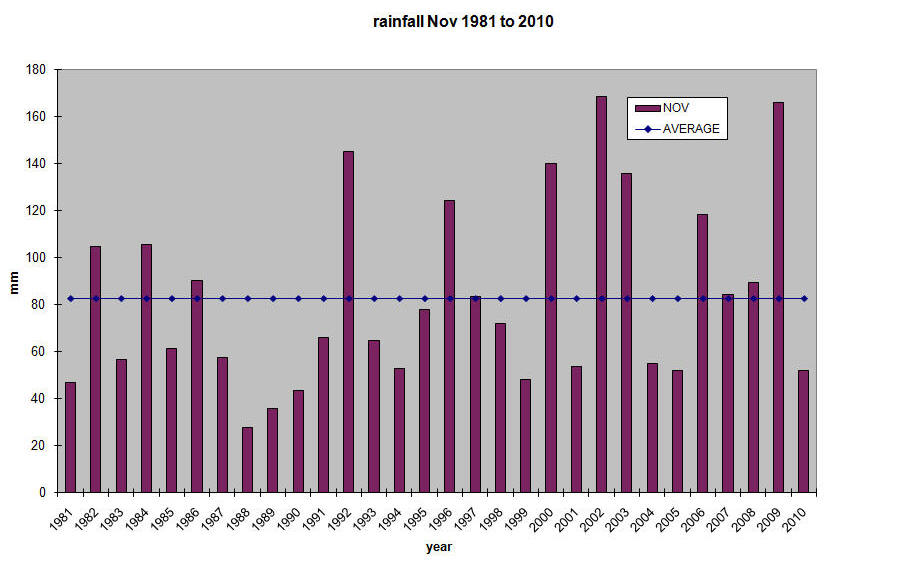
Talk about the sting in the tail! We do not usually get such low temperatures at the end November but snow (or sleet) is not unheard of. Going back to 1985 I find that there was some snow/sleet in 9 of the years; only a couple of days at most and generally followed by rain which probably washed it away. In fact there were small amounts of snow/sleet each November from 2004 to 2008. The earliest date I have is the 8th in 2001. However not very pleasant whichever way you look at it. Talking to one of the local farmers yesterday (3rd), he couldn’t remember an end of November when the water troughs had remained frozen for so long. It was not an especially wet month but we did have precipitation on 21 days and 4 of those saw snow. Better than 2009 when it rained on all 30 days of the month. A real contrast was the range of maximum temperatures; 17.3ºC on the 4th and down to -0.3ºC on the 30th. Still, we have been very lucky when compared with areas to the east and south of us. Let us hope that the luck continues!
The rainfall graph is shown below.
Gary Beynon Top of Page Home Weather Reports 2009
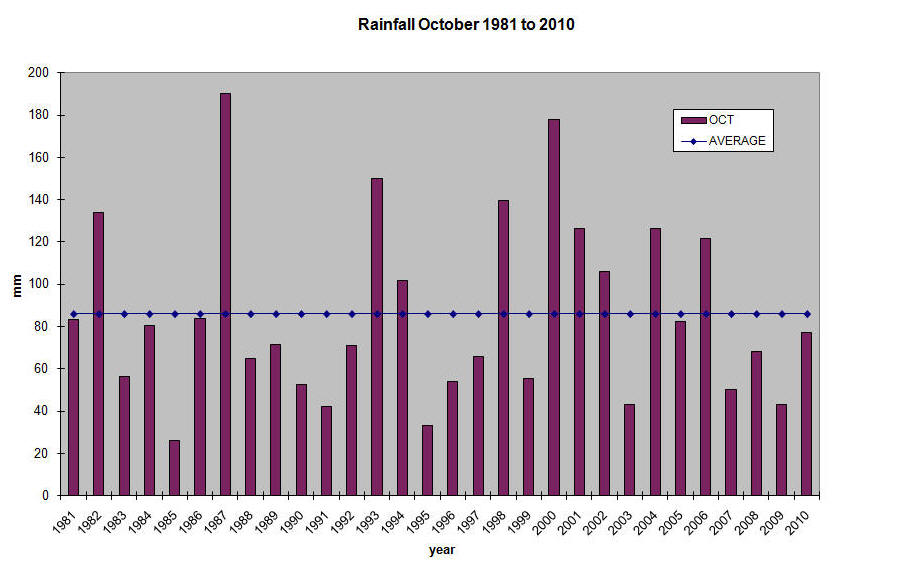
October started as September finished; wet. The first 2 days saw 32 mm of rain, almost 50% of the months total. There was a dry period during the second week and then more rain. Generally rainfall was not in large amounts but enough to keep everything wet and rather miserable. There were also 4 days of frost which hit the dahlias and runner beans hard not to mention the windscreen scraping! In contrast the temperature reached 20.5 ºC on the 8th and was above 15 ºC for 11 days. It was a month of contrasts. Compared with 2009, the two Octobers were not dissimilar; both mild, wet some days and pleasant sunshine on others.
Gary Beynon Top of Page Home Weather Reports 2009
August and September were two very different months; we can further complicate matters by adding in July. August was the filling in the sandwich; not as it transpired a very pleasant filling. It really was very wet through August and that after such a dry July (and remember that April, May and June were also dry culminating in brown dry grass—now look at it!). At 148 mm of rain over 22 days, August was a month to remember. Temperatures in August and September were not dissimilar although the colder period in the last week of September was enough to bring down the average temperature for the month as a whole. The two wettest days in August, 22nd and 25th, both had in excess of 25 mm (1 inch in the old convention). By comparison, September’s wettest day saw just 14.1 mm but that was some 25% of the month’s total. I wonder how we will remember the 2010 summer? Will it be the warm weather of late June and much of July, or will it be the wet August?
Rainfall graphs:
Gary Beynon Top of Page Home Weather Reports 2009
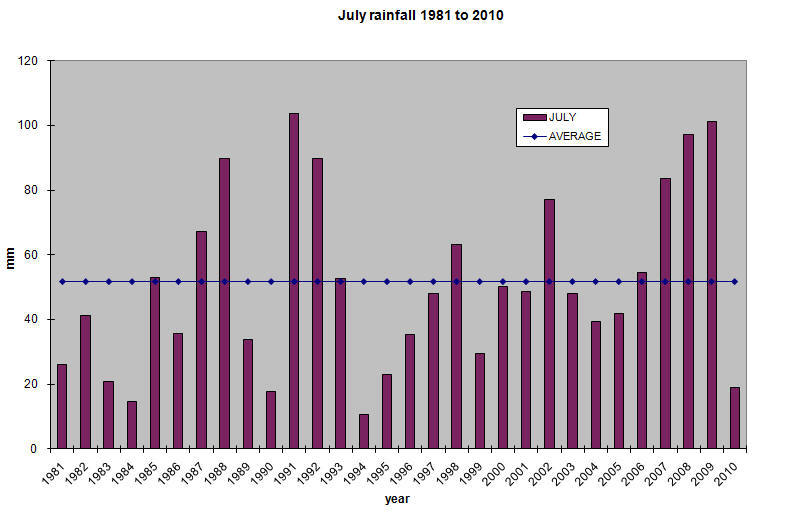
Another Dry month; this July was actually the driest since 1994. We have now had 4 months. April to July, with below average rainfall. The average total is 233 mm and we have had 99.3 mm. There is little wonder that the grass looks so brown. However compared with other parts of the world we have nothing to grumble about; massive floods in Pakistan and fires destroying woods and the cereal crop in Russia. Although Hyde Heath has had a dry month, the news reported that it was one of the wettest months for ages (in other parts of the country!). It does seem strange the number of times that rain coming in from the West just peters out before it gets here. What has also been noticeable is the variation over short distances. We have had torrential downpours at Potter Row but found the road dry just past the Barley Mow on the way back to Hyde Heath. It is little wonder that the forecasters have so much of a problem. Here is the data for the month.
Gary Beynon Top of Page Home Weather Reports 2009
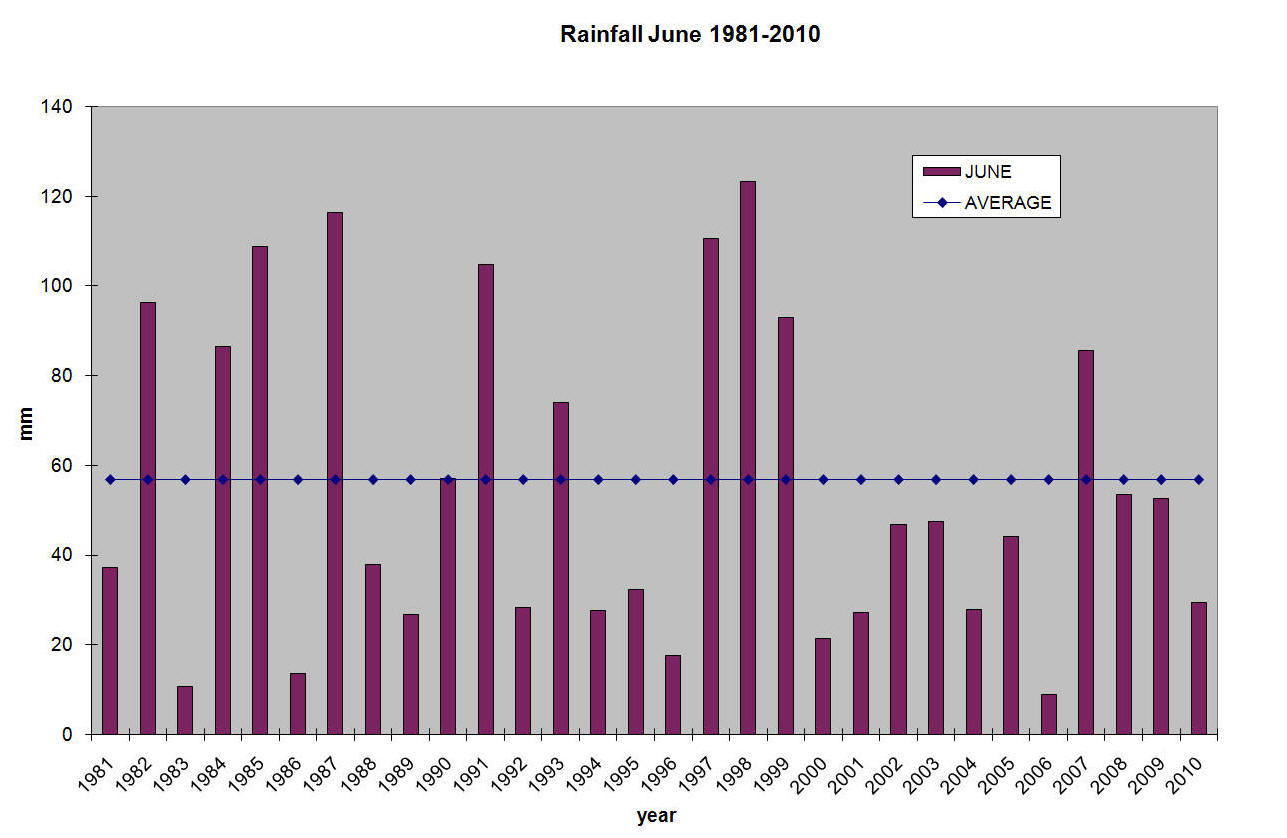
A month of two parts; the first half saw quite a lot of rain (that’s the funny wet stuff that comes out of the sky and stops the grass going brown), and the end part that was dry and saw a period of high sustained temperatures. Although it was the latter part of June that had the highest temperatures, the first few days gave a high of 27º C which was very continental. June 2009 actually started with nearly 26º on the first day and statistically was very similar to 2010. In fact if it hadn’t been for one day, the 6th, when 19.8 mm of rain fell the total rainfall for the two years would have been very similar. What does this prove? Probably nothing; just coincidental.
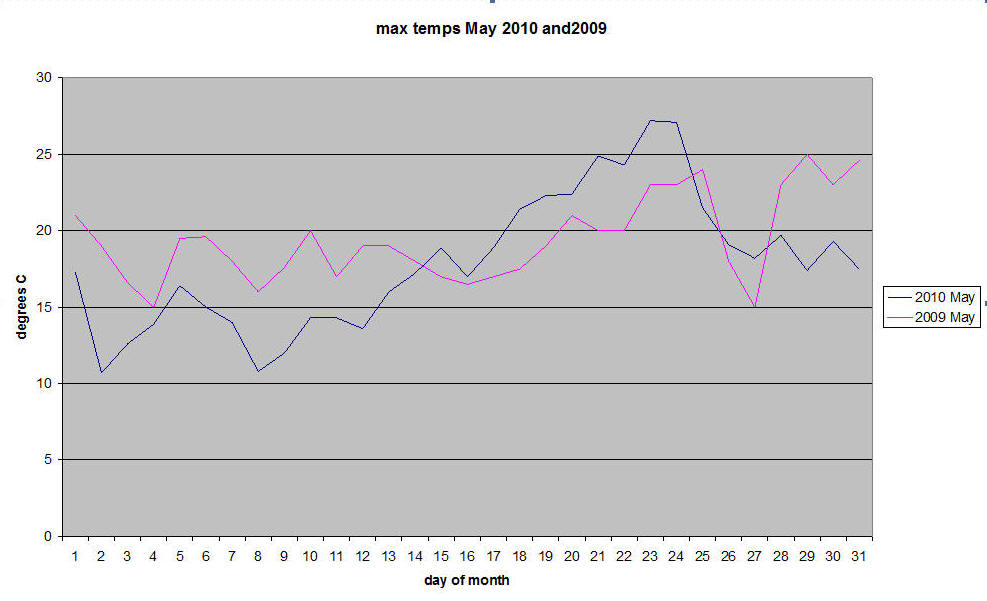
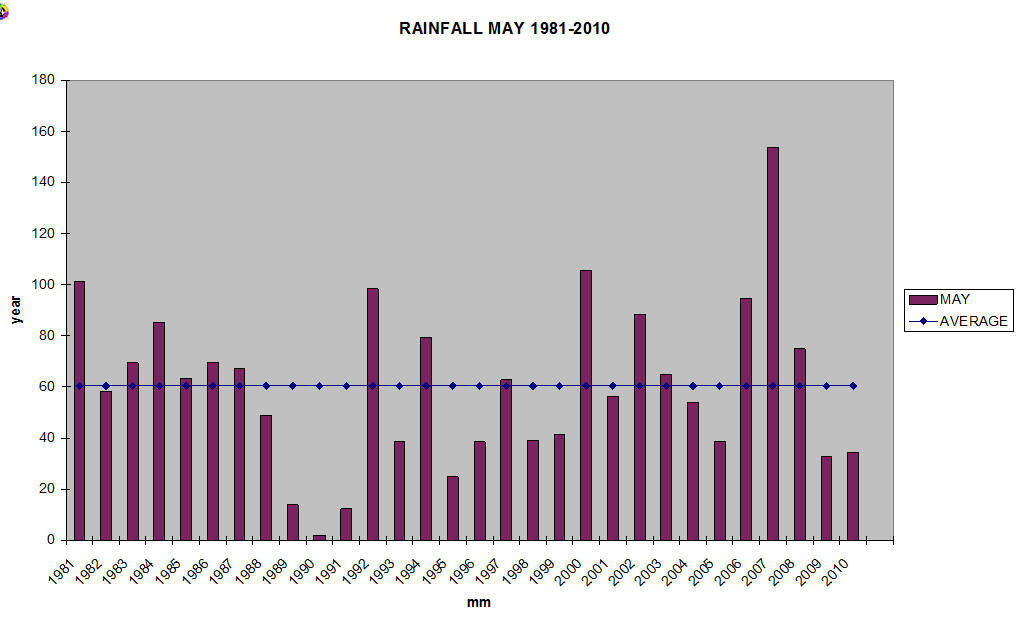
Gary Beynon Top of Page Home Weather Reports 2009 A month of contrasts could be an apt description for this last May. The temperature soared into the upper 20s (albeit for just 2 days!) and plummeted to just above freezing with a touch of air frost on 2 early mornings. It was another fairly dry month with only 11 days of measurable rainfall. The second half of the month was a good deal warmer than the first half and it did look as if summer had come early but there was a north or north westerly wind that kept the feel of the temperatures down. Compared with last year the figures for the 2 months were, on the face of it, quite similar but the temperature variation was marked; please see the temperature graph reproduced below. Certainly the dry period with the wind taking away surface moisture quickly has not helped the fields being grown for hay; and when you have horses this matters!
Gary Beynon Top of Page Home Weather Reports 2009
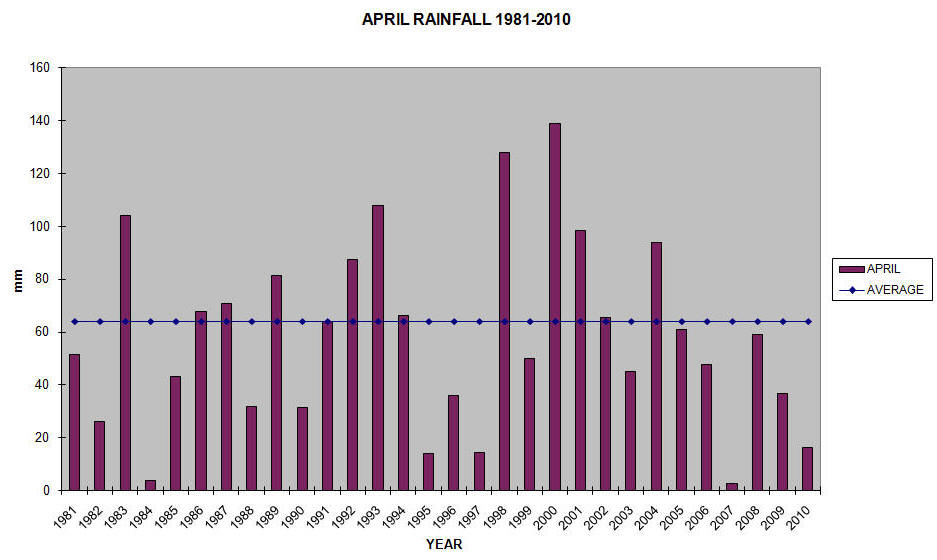
The month changed from March to April and very quickly the weather changed as well. The end of March was pretty wet whereas April as a whole was dry. There were just 16.4 mm of rain in the whole month (I expected to be able to say that the 1st day of May had more than that; but it didn’t—only 10.9 mm). This compares with an average since 1981 of 64 mm. There is within that a tremendous variation from the driest April in 2007 with just 2.6 mm to 139 mm in 2000. I read or heard somewhere that a dry April meant a wet summer (June, July and August). Looking at the figures I can’t see any pattern for Hyde Heath. In 2007 the summer was indeed wet, as was 1997 but 1995 was dry and so was 1984. Looks a bit like swings and roundabouts! Temperatures were a little down on last year and there were those annoying frosts. This year had a higher maximum temperature than 2009 though at 22.3ºC.
The rainfall chart is shown below
Gary Beynon Top of Page Home Weather Reports 2009
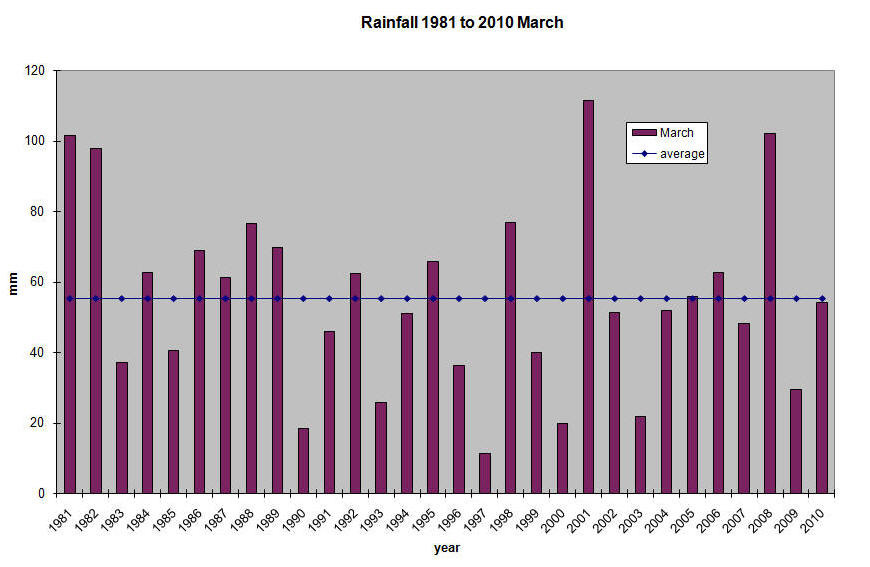
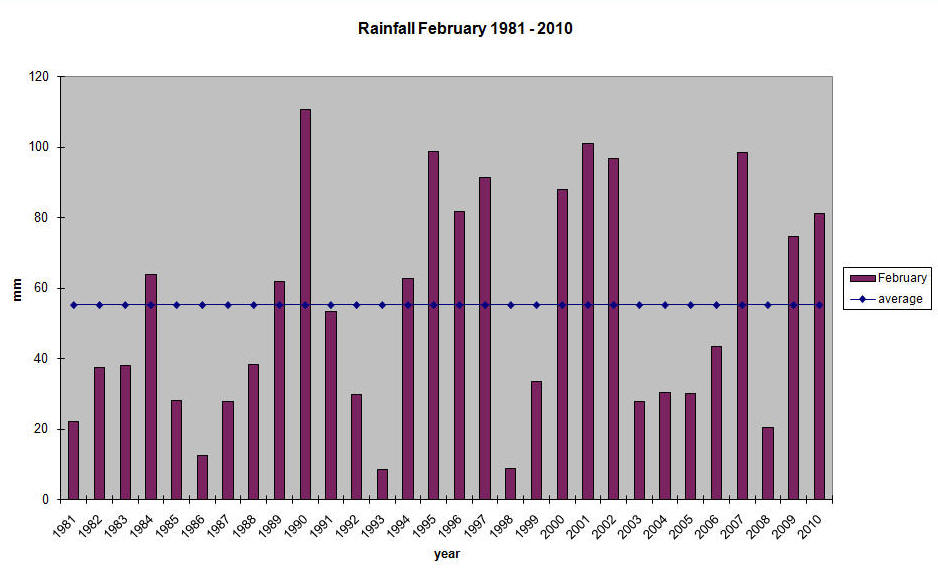
February changed to March and the weather changed with the date. February was wet with 27 days of measurable rainfall; March started very dry with just 2 days of rain in the first 17 and then only a mere 3.2 mm. Then all change again with 13 of the remaining 14 days having rainfall. On 1 day there was actually thunder which I normally associate with the summer not the end of winter. The temperature range was large with a maximum on the 18th of 17.6º C and a minimum of -3.7º C on the 6th. Overall the month was dull with 14 days of some sunshine and 17 days when it was overcast. Actually not dissimilar from March last year. Rainfall was higher than last year but very close to the average over the last 29 years.
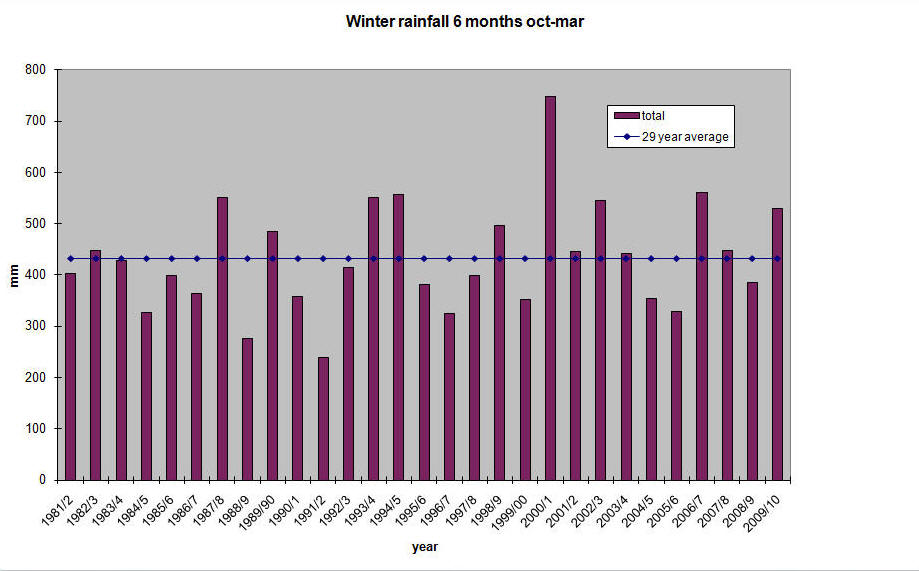
WATER RESTRICTIONS THIS SUMMER? The months through the winter from October to March are the ones that count for replenishing the water table. It is, we are told, the ‘health’ of the water table that determines whether or not there will be restrictions on our use of water during the summer months. Clearly the warmth of the summer and the extent to which we use water must also be a factor. However the rainfall over these last 6 months has been above average and indeed higher than the 2008/9 winter period. This winter we have had 529.7 mm compared with last winter (2008/9) at 385.1 mm and an average over the last 29 years of 432.53 mm. So, water restrictions, I would think not------but don’t quote me! The bar chart is shown below.
Gary Beynon Top of Page Home Weather Reports 2009
Not a very pleasant month. It didn’t seem to be that wet to start with but we finished up with 27 days of precipitation (13 of which had snow or sleet) and an above average rainfall for the month. Well over half the rain came in the last 10 days, hence the rather soggy look to the gardens and fields. I suppose that the wet followed by successive frosts was at least partly responsible for the re-emergence of the infamous potholes; nothing to do with the very poor way in which they were first “mended” of course. The temperature didn’t go that low; only -1.5ºC but it didn’t get that high either and this combined with the dull wet weather left us all with a not very good feeling.
Gary Beynon Top of Page Home Weather Reports 2009
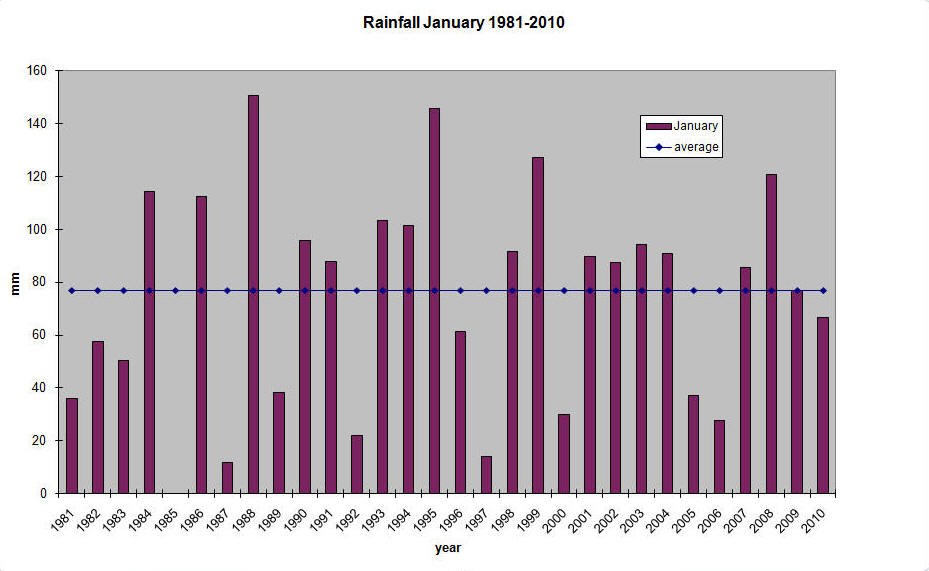
How will January go into
our memory banks? Snow, ice, terrible travelling conditions and an
aftermath of infamous potholes may well be in your list. A small amount of
snow does seem to cause inordinate chaos now and yet we used to cope. As I
write this, the reports from the States are of 3 foot of snow; even they
have ground to a standstill. It is very difficult to measure the
equivalent rainfall when it comes as snow. Snow doesn’t behave like rain;
rain falls neatly into the gauge and is easily measured. Snow however
blows around, cones above the rim of the gauge and, when it melts, may or
may not give the equivalent rain measure. The method that I use is to
measure the depth of new snow in 3 different places, avoiding obvious
drift areas, take an average and use the formula of 1 foot of snow being
equivalent to 1 inch of rain (25.4 mm). This January, the amount of melt
in the gauge was close to the formula figure. My data recorded 16-18 cms
depth of fresh snow ie about 12-14 mm). |
|||||||||||||||||||||||||||||||||||||||||||||||||||||||||||||||||||||||||||||||||||||||||||||||||||||||||||||||||||||||||||||||||||||||||||||||||||||||||||||||||||||||||||||||||||||||||||||||||||||||||||||||||||||||||||||||||||||||||||||||||||||||||||||||||||||||||||||||||||||||||||||||||||||||||||||||||||||||||||||||||||||||||||||||||||||||||||||||||||||||||||||||||||||||||||||||||||||||||||||||||||||||||||||||||||||||||||||||||||||||||||||||||||||||||||||||||||||||||||||||||||||||||||||||||||||||||||||||||||||||||||||||||||||||||||||||||||||||||||||||||||||||||||||||||||||||||||||||||||||||||||||||||||||||||||||||||||||||||||||||||||||||||||||||||||||||||||||||||||||||||||||||||||||||||||||||||||||||||||||||||||||||||||||||||||||||||||||||||||||||||||||||||||||||||||||||||||||||||||||||||||||||||||||||||||||
|
|
January 2010 Statistics | 2010 | 2009 | ||||||||||||||||||||||||||||||||||||||||||||||||||||||||||||||||||||||||||||||||||||||||||||||||||||||||||||||||||||||||||||||||||||||||||||||||||||||||||||||||||||||||||||||||||||||||||||||||||||||||||||||||||||||||||||||||||||||||||||||||||||||||||||||||||||||||||||||||||||||||||||||||||||||||||||||||||||||||||||||||||||||||||||||||||||||||||||||||||||||||||||||||||||||||||||||||||||||||||||||||||||||||||||||||||||||||||||||||||||||||||||||||||||||||||||||||||||||||||||||||||||||||||||||||||||||||||||||||||||||||||||||||||||||||||||||||||||||||||||||||||||||||||||||||||||||||||||||||||||||||||||||||||||||||||||||||||||||||||||||||||||||||||||||||||||||||||||||||||||||||||||||||||||||||||||||||||||||||||||||||||||||||||||||||||||||||||||||||||||||||||||||||||||||||||||||||||||||||||||||||||||||||||||||||||
| Maximum temp. ºC | 8.3 | 9.0 | |||||||||||||||||||||||||||||||||||||||||||||||||||||||||||||||||||||||||||||||||||||||||||||||||||||||||||||||||||||||||||||||||||||||||||||||||||||||||||||||||||||||||||||||||||||||||||||||||||||||||||||||||||||||||||||||||||||||||||||||||||||||||||||||||||||||||||||||||||||||||||||||||||||||||||||||||||||||||||||||||||||||||||||||||||||||||||||||||||||||||||||||||||||||||||||||||||||||||||||||||||||||||||||||||||||||||||||||||||||||||||||||||||||||||||||||||||||||||||||||||||||||||||||||||||||||||||||||||||||||||||||||||||||||||||||||||||||||||||||||||||||||||||||||||||||||||||||||||||||||||||||||||||||||||||||||||||||||||||||||||||||||||||||||||||||||||||||||||||||||||||||||||||||||||||||||||||||||||||||||||||||||||||||||||||||||||||||||||||||||||||||||||||||||||||||||||||||||||||||||||||||||||||||||||||
| Mean max. ºC | 3.87 | 5.52 | |||||||||||||||||||||||||||||||||||||||||||||||||||||||||||||||||||||||||||||||||||||||||||||||||||||||||||||||||||||||||||||||||||||||||||||||||||||||||||||||||||||||||||||||||||||||||||||||||||||||||||||||||||||||||||||||||||||||||||||||||||||||||||||||||||||||||||||||||||||||||||||||||||||||||||||||||||||||||||||||||||||||||||||||||||||||||||||||||||||||||||||||||||||||||||||||||||||||||||||||||||||||||||||||||||||||||||||||||||||||||||||||||||||||||||||||||||||||||||||||||||||||||||||||||||||||||||||||||||||||||||||||||||||||||||||||||||||||||||||||||||||||||||||||||||||||||||||||||||||||||||||||||||||||||||||||||||||||||||||||||||||||||||||||||||||||||||||||||||||||||||||||||||||||||||||||||||||||||||||||||||||||||||||||||||||||||||||||||||||||||||||||||||||||||||||||||||||||||||||||||||||||||||||||||||
| Minimum temp. ºC | -5.3 | -6 | |||||||||||||||||||||||||||||||||||||||||||||||||||||||||||||||||||||||||||||||||||||||||||||||||||||||||||||||||||||||||||||||||||||||||||||||||||||||||||||||||||||||||||||||||||||||||||||||||||||||||||||||||||||||||||||||||||||||||||||||||||||||||||||||||||||||||||||||||||||||||||||||||||||||||||||||||||||||||||||||||||||||||||||||||||||||||||||||||||||||||||||||||||||||||||||||||||||||||||||||||||||||||||||||||||||||||||||||||||||||||||||||||||||||||||||||||||||||||||||||||||||||||||||||||||||||||||||||||||||||||||||||||||||||||||||||||||||||||||||||||||||||||||||||||||||||||||||||||||||||||||||||||||||||||||||||||||||||||||||||||||||||||||||||||||||||||||||||||||||||||||||||||||||||||||||||||||||||||||||||||||||||||||||||||||||||||||||||||||||||||||||||||||||||||||||||||||||||||||||||||||||||||||||||||||
| Mean min ºC | 0.039 | 0.3 | |||||||||||||||||||||||||||||||||||||||||||||||||||||||||||||||||||||||||||||||||||||||||||||||||||||||||||||||||||||||||||||||||||||||||||||||||||||||||||||||||||||||||||||||||||||||||||||||||||||||||||||||||||||||||||||||||||||||||||||||||||||||||||||||||||||||||||||||||||||||||||||||||||||||||||||||||||||||||||||||||||||||||||||||||||||||||||||||||||||||||||||||||||||||||||||||||||||||||||||||||||||||||||||||||||||||||||||||||||||||||||||||||||||||||||||||||||||||||||||||||||||||||||||||||||||||||||||||||||||||||||||||||||||||||||||||||||||||||||||||||||||||||||||||||||||||||||||||||||||||||||||||||||||||||||||||||||||||||||||||||||||||||||||||||||||||||||||||||||||||||||||||||||||||||||||||||||||||||||||||||||||||||||||||||||||||||||||||||||||||||||||||||||||||||||||||||||||||||||||||||||||||||||||||||||
| Days with frost | 16 | 20 | |||||||||||||||||||||||||||||||||||||||||||||||||||||||||||||||||||||||||||||||||||||||||||||||||||||||||||||||||||||||||||||||||||||||||||||||||||||||||||||||||||||||||||||||||||||||||||||||||||||||||||||||||||||||||||||||||||||||||||||||||||||||||||||||||||||||||||||||||||||||||||||||||||||||||||||||||||||||||||||||||||||||||||||||||||||||||||||||||||||||||||||||||||||||||||||||||||||||||||||||||||||||||||||||||||||||||||||||||||||||||||||||||||||||||||||||||||||||||||||||||||||||||||||||||||||||||||||||||||||||||||||||||||||||||||||||||||||||||||||||||||||||||||||||||||||||||||||||||||||||||||||||||||||||||||||||||||||||||||||||||||||||||||||||||||||||||||||||||||||||||||||||||||||||||||||||||||||||||||||||||||||||||||||||||||||||||||||||||||||||||||||||||||||||||||||||||||||||||||||||||||||||||||||||||||
| Days with snow | 8 | 4 | |||||||||||||||||||||||||||||||||||||||||||||||||||||||||||||||||||||||||||||||||||||||||||||||||||||||||||||||||||||||||||||||||||||||||||||||||||||||||||||||||||||||||||||||||||||||||||||||||||||||||||||||||||||||||||||||||||||||||||||||||||||||||||||||||||||||||||||||||||||||||||||||||||||||||||||||||||||||||||||||||||||||||||||||||||||||||||||||||||||||||||||||||||||||||||||||||||||||||||||||||||||||||||||||||||||||||||||||||||||||||||||||||||||||||||||||||||||||||||||||||||||||||||||||||||||||||||||||||||||||||||||||||||||||||||||||||||||||||||||||||||||||||||||||||||||||||||||||||||||||||||||||||||||||||||||||||||||||||||||||||||||||||||||||||||||||||||||||||||||||||||||||||||||||||||||||||||||||||||||||||||||||||||||||||||||||||||||||||||||||||||||||||||||||||||||||||||||||||||||||||||||||||||||||||||
| Total rain/snow days | 18 | 16 | |||||||||||||||||||||||||||||||||||||||||||||||||||||||||||||||||||||||||||||||||||||||||||||||||||||||||||||||||||||||||||||||||||||||||||||||||||||||||||||||||||||||||||||||||||||||||||||||||||||||||||||||||||||||||||||||||||||||||||||||||||||||||||||||||||||||||||||||||||||||||||||||||||||||||||||||||||||||||||||||||||||||||||||||||||||||||||||||||||||||||||||||||||||||||||||||||||||||||||||||||||||||||||||||||||||||||||||||||||||||||||||||||||||||||||||||||||||||||||||||||||||||||||||||||||||||||||||||||||||||||||||||||||||||||||||||||||||||||||||||||||||||||||||||||||||||||||||||||||||||||||||||||||||||||||||||||||||||||||||||||||||||||||||||||||||||||||||||||||||||||||||||||||||||||||||||||||||||||||||||||||||||||||||||||||||||||||||||||||||||||||||||||||||||||||||||||||||||||||||||||||||||||||||||||||
| Rainfall (snow equiv) mm | 66.8 | 76.8 | |||||||||||||||||||||||||||||||||||||||||||||||||||||||||||||||||||||||||||||||||||||||||||||||||||||||||||||||||||||||||||||||||||||||||||||||||||||||||||||||||||||||||||||||||||||||||||||||||||||||||||||||||||||||||||||||||||||||||||||||||||||||||||||||||||||||||||||||||||||||||||||||||||||||||||||||||||||||||||||||||||||||||||||||||||||||||||||||||||||||||||||||||||||||||||||||||||||||||||||||||||||||||||||||||||||||||||||||||||||||||||||||||||||||||||||||||||||||||||||||||||||||||||||||||||||||||||||||||||||||||||||||||||||||||||||||||||||||||||||||||||||||||||||||||||||||||||||||||||||||||||||||||||||||||||||||||||||||||||||||||||||||||||||||||||||||||||||||||||||||||||||||||||||||||||||||||||||||||||||||||||||||||||||||||||||||||||||||||||||||||||||||||||||||||||||||||||||||||||||||||||||||||||||||||||
|
|
|||||||||||||||||||||||||||||||||||||||||||||||||||||||||||||||||||||||||||||||||||||||||||||||||||||||||||||||||||||||||||||||||||||||||||||||||||||||||||||||||||||||||||||||||||||||||||||||||||||||||||||||||||||||||||||||||||||||||||||||||||||||||||||||||||||||||||||||||||||||||||||||||||||||||||||||||||||||||||||||||||||||||||||||||||||||||||||||||||||||||||||||||||||||||||||||||||||||||||||||||||||||||||||||||||||||||||||||||||||||||||||||||||||||||||||||||||||||||||||||||||||||||||||||||||||||||||||||||||||||||||||||||||||||||||||||||||||||||||||||||||||||||||||||||||||||||||||||||||||||||||||||||||||||||||||||||||||||||||||||||||||||||||||||||||||||||||||||||||||||||||||||||||||||||||||||||||||||||||||||||||||||||||||||||||||||||||||||||||||||||||||||||||||||||||||||||||||||||||||||||||||||||||||||||||||
| Rainfall Graph Below : | |||||||||||||||||||||||||||||||||||||||||||||||||||||||||||||||||||||||||||||||||||||||||||||||||||||||||||||||||||||||||||||||||||||||||||||||||||||||||||||||||||||||||||||||||||||||||||||||||||||||||||||||||||||||||||||||||||||||||||||||||||||||||||||||||||||||||||||||||||||||||||||||||||||||||||||||||||||||||||||||||||||||||||||||||||||||||||||||||||||||||||||||||||||||||||||||||||||||||||||||||||||||||||||||||||||||||||||||||||||||||||||||||||||||||||||||||||||||||||||||||||||||||||||||||||||||||||||||||||||||||||||||||||||||||||||||||||||||||||||||||||||||||||||||||||||||||||||||||||||||||||||||||||||||||||||||||||||||||||||||||||||||||||||||||||||||||||||||||||||||||||||||||||||||||||||||||||||||||||||||||||||||||||||||||||||||||||||||||||||||||||||||||||||||||||||||||||||||||||||||||||||||||||||||||||||
 |
|||||||||||||||||||||||||||||||||||||||||||||||||||||||||||||||||||||||||||||||||||||||||||||||||||||||||||||||||||||||||||||||||||||||||||||||||||||||||||||||||||||||||||||||||||||||||||||||||||||||||||||||||||||||||||||||||||||||||||||||||||||||||||||||||||||||||||||||||||||||||||||||||||||||||||||||||||||||||||||||||||||||||||||||||||||||||||||||||||||||||||||||||||||||||||||||||||||||||||||||||||||||||||||||||||||||||||||||||||||||||||||||||||||||||||||||||||||||||||||||||||||||||||||||||||||||||||||||||||||||||||||||||||||||||||||||||||||||||||||||||||||||||||||||||||||||||||||||||||||||||||||||||||||||||||||||||||||||||||||||||||||||||||||||||||||||||||||||||||||||||||||||||||||||||||||||||||||||||||||||||||||||||||||||||||||||||||||||||||||||||||||||||||||||||||||||||||||||||||||||||||||||||||||||||||||
| Gary Beynon - Feb 8th 2010 | |||||||||||||||||||||||||||||||||||||||||||||||||||||||||||||||||||||||||||||||||||||||||||||||||||||||||||||||||||||||||||||||||||||||||||||||||||||||||||||||||||||||||||||||||||||||||||||||||||||||||||||||||||||||||||||||||||||||||||||||||||||||||||||||||||||||||||||||||||||||||||||||||||||||||||||||||||||||||||||||||||||||||||||||||||||||||||||||||||||||||||||||||||||||||||||||||||||||||||||||||||||||||||||||||||||||||||||||||||||||||||||||||||||||||||||||||||||||||||||||||||||||||||||||||||||||||||||||||||||||||||||||||||||||||||||||||||||||||||||||||||||||||||||||||||||||||||||||||||||||||||||||||||||||||||||||||||||||||||||||||||||||||||||||||||||||||||||||||||||||||||||||||||||||||||||||||||||||||||||||||||||||||||||||||||||||||||||||||||||||||||||||||||||||||||||||||||||||||||||||||||||||||||||||||||||
| Top of Page Home Weather Reports 2009 | |||||||||||||||||||||||||||||||||||||||||||||||||||||||||||||||||||||||||||||||||||||||||||||||||||||||||||||||||||||||||||||||||||||||||||||||||||||||||||||||||||||||||||||||||||||||||||||||||||||||||||||||||||||||||||||||||||||||||||||||||||||||||||||||||||||||||||||||||||||||||||||||||||||||||||||||||||||||||||||||||||||||||||||||||||||||||||||||||||||||||||||||||||||||||||||||||||||||||||||||||||||||||||||||||||||||||||||||||||||||||||||||||||||||||||||||||||||||||||||||||||||||||||||||||||||||||||||||||||||||||||||||||||||||||||||||||||||||||||||||||||||||||||||||||||||||||||||||||||||||||||||||||||||||||||||||||||||||||||||||||||||||||||||||||||||||||||||||||||||||||||||||||||||||||||||||||||||||||||||||||||||||||||||||||||||||||||||||||||||||||||||||||||||||||||||||||||||||||||||||||||||||||||||||||||||