 |
Hyde Heath Weather 2013 |
 |
 |
|
|
Hyde Heath Weather 2013 |
|
|
|
| Home | Weather 2008/9 | Weather 2010 | Weather 2011 | Weather 2012 | |
|
Hyde Heath weather reports by Gary Beynon based on his own observations & measurements |
|||||
| January | February | March | April | May | June |
| July | August | September | October | November | December |
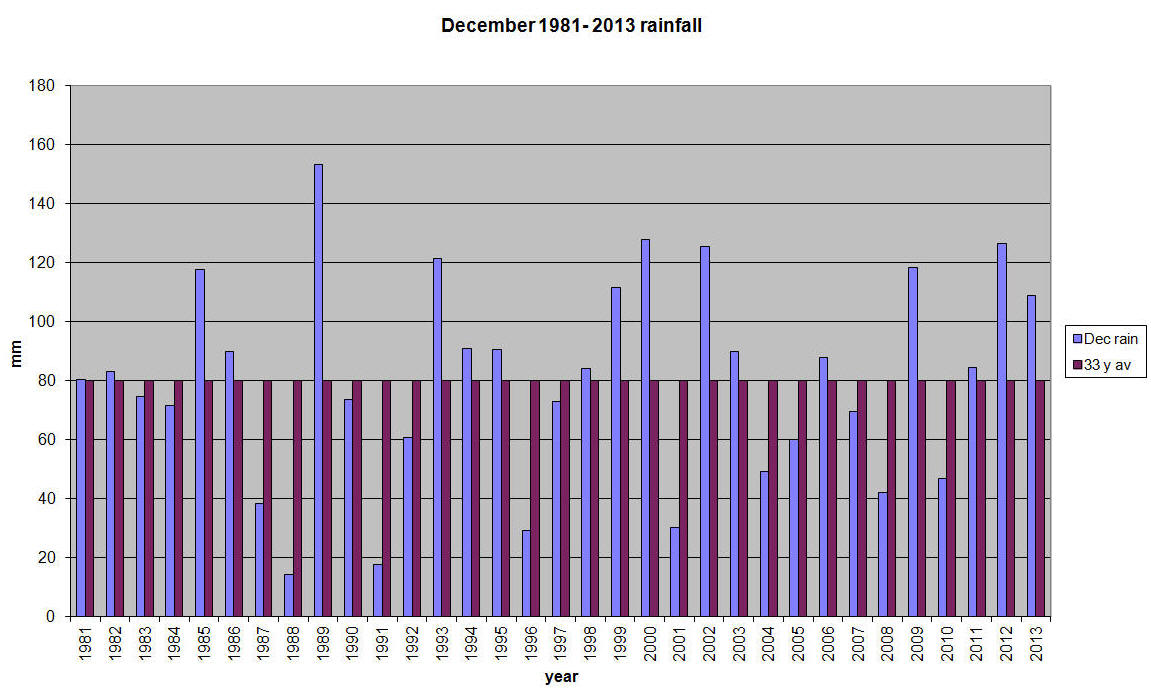
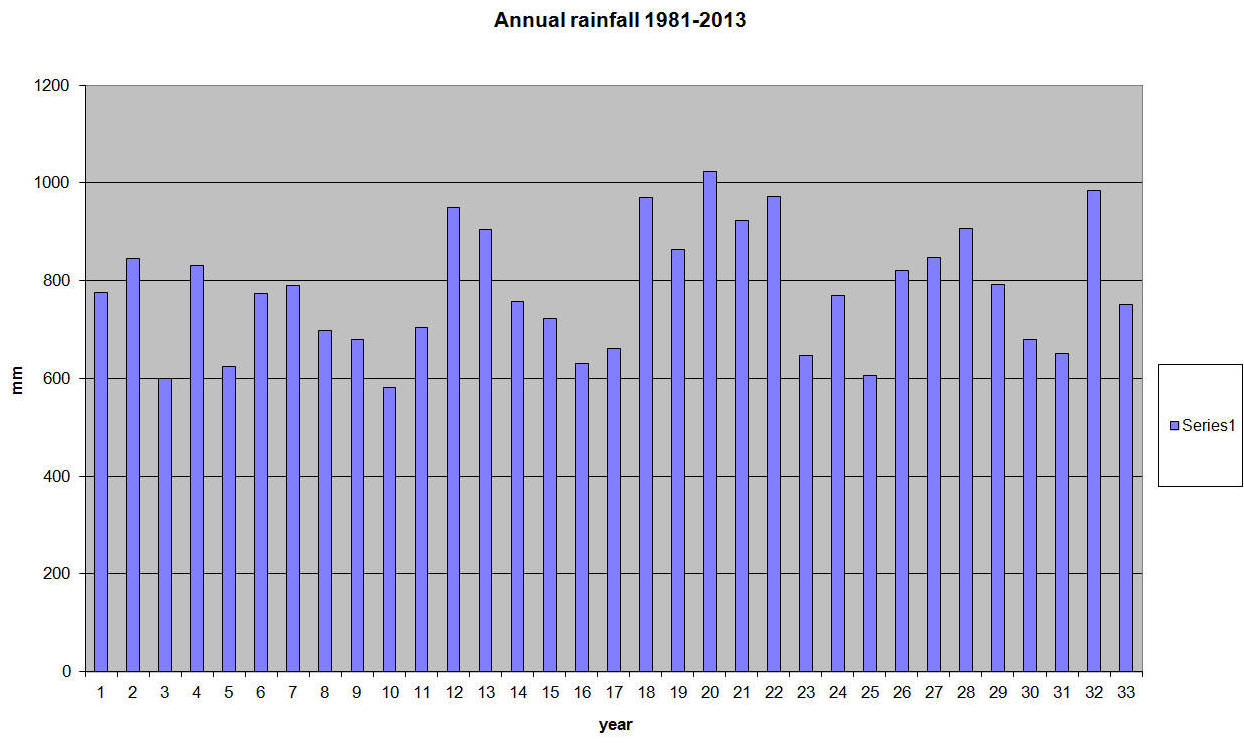
December 2013 December was a month of two distinct halves. The first 14 days were dry and mild; only 4.7mm rain with temperatures hovering around the 9ºC mark. Pressure was also high between 1013 and 1029 mbar. The remaining days were wet with just 2 without rainfall and over 100 mm recorded. Pressure fell up to 60mbar with a low of 966. As everyone will remember this have a number of intense depressions with high and damaging winds. We were, however, very lucky compared with areas just a short distance from us. There were frosts on 6 days as evidenced by the sound of windscreens being scraped in the early morning. This has all resulted in saturated ground so that even a small amount of rain causes large puddles. What of 2013 as a year? What will we all remember? The storm in October on St Jude’s day, the dry summer months, the rather miserable January to March or the bumper crop of apples? I will go for the apples; it is so much more positive. The rainfall through the year was just below the average for the last 33 years but the “fill dyke months (October to March) have started with plenty of rain. Facts and figures December 2013 December 2012 Maximum temp ºC 12.8 12.5 Mean max temp ºC 9.13 7.65 Days temp > 10 ºC 9 6 Minimum temp ºC 0.8 -4.9 Mean min temp ºC 3.42 2.29 Days min < 0 ºC 0 8 Days with frost 6 11 Rainfall mm 108.8 126.5 Days with rain 22 26 December average rainfall 80.024mm Annual rainfall for 2013 751.5mm 33 year average annual rainfall 779.98mm
Gary Beynon
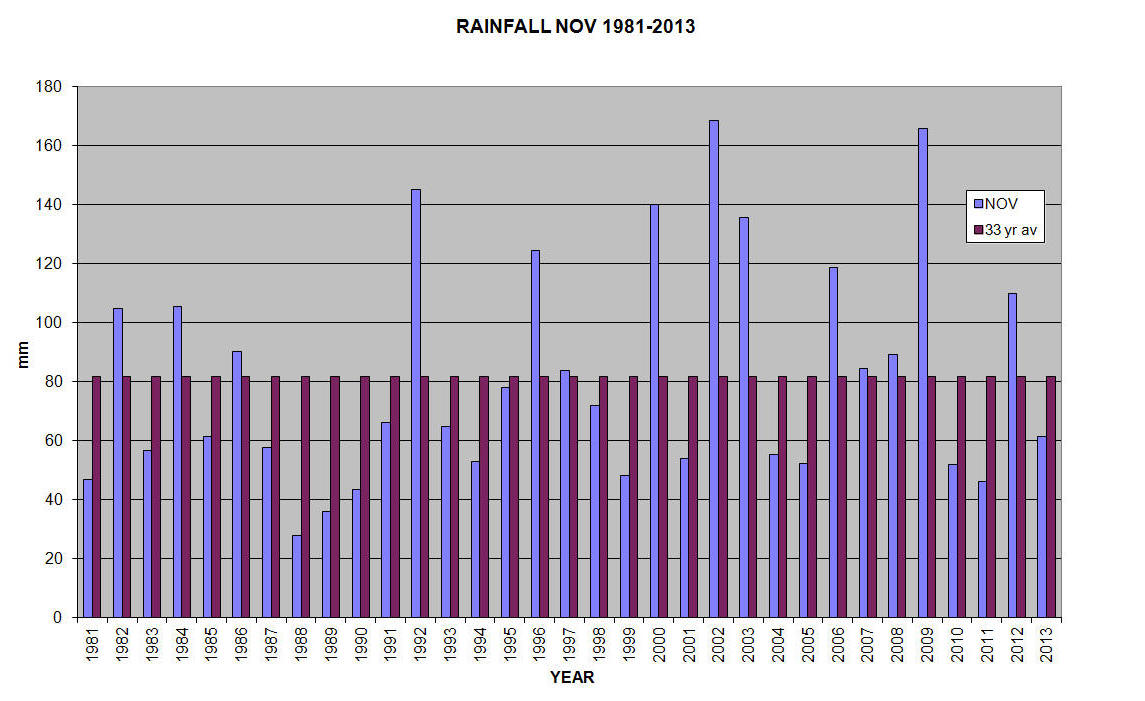
November was a dull month; there were far more days when it was cloudy(and/or raining) than clear. It was not particularly wet, the rainfall being below average but there were a lot of days when something fell out of the sky. One day saw a mixture of rain, sleet and hail all in a very short period of time; fortunately it did not last. It was also milder than we might have expected. There were a number of mornings when frost was evident on the cars but only one day when the air temperature fell below 0ºC. Compared with last year, the month’s temperatures were very similar statistically. We cannot have had the wind or the frost that often comes as evidenced by the leaves that are still on the trees. Facts and figures. November 2013 November 2012 Maximum temperature ºC 13.7 13.7 Mean max temp. ºC 9.17 9.50 Days temp > 10ºC 10 14 Minimum temperature ºC -1.0 -1.4 Mean min temp. ºC 3.82 3.70 Days temp <5ºC 22 20 Days temp <0ºC 1 2 Rainfall mm 61.4 109.8 Days with rain 21 20 33 year average rainfall mm 81.76 Years below average 22 Years above average 11 Wettest 2002 with 168.5mm Driest 1988 with 27.6mm
Gary Beynon
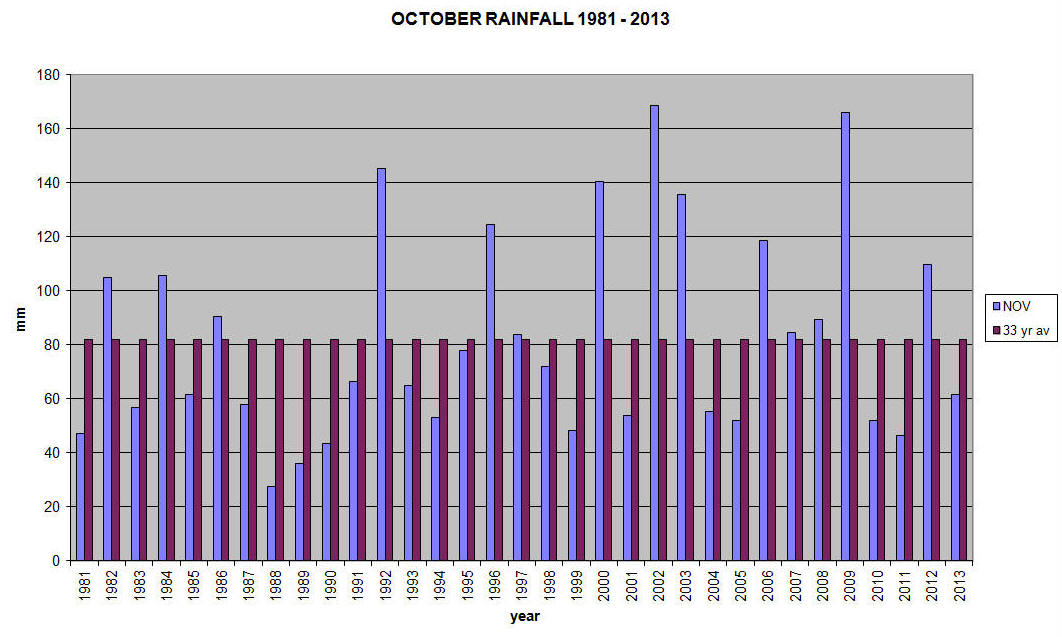
After a succession of drier than average months, October started the “fill dyke” season with an above average performance. It was not the wettest October that we have had but in the last 33 years there have only been 12 years with above average rainfall in October. The wettest October was 1987 with 177.8 mm. It was a month to remember; at least for a short time. It was mild, it had (or perhaps more accurately) was threatened with damaging winds and there were no frosts. We were lucky as far as the high winds were concerned; the brunt of the storm missed Hyde Heath and looks to have tracked south and then east of us. There was some damage unfortunately and a number of trees came down causing short term chaos. However compared with many we were very lucky to escape the worst. The facts and figures October 2013 October 2012 Maximum temperature ºC 19.3 17.2 Mean max temp ºC 15.37 13.47 Days temp >15ºC 19 10 Minimum temperature ºC 3.5 1.2 Mean min temp ºC 9.64 6.96 Days temp <10ºC 14 26 Days with frost 0 2 Rainfall mm 114.3 122.9 Days with rainfall 23 22 Average rainfall over last 33 years 86.18 Wettest October 177.8 in 1987
Rainfall chart
Gary Beynon
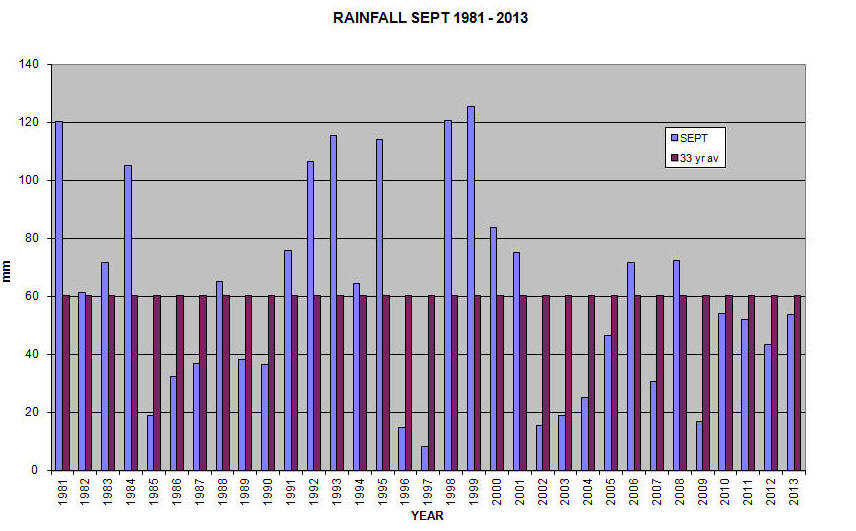
With September coming to an end, there have now been 4 drier than average months in a row. I suspect that most people will have noticed this by the way in which the grass didn’t grow much and it turned brown in patches. A big advantage of the drier weather is that the harvest has been gathered in and, apparently, has been good because of the weather pattern over the preceding months. Those who are fortunate to have apple trees will also have noticed the bumper crop; again due to the weather pattern. September was also pleasantly warm with the first week having temperatures in the 20s. Although the maximum temperatures then fell into the teens (actually when we were away enjoying the low 30s!), things perked up again at the end of the month. The rain did come but most fell on just 2 days accounting for 33 out of the 54 mm total.
Facts and figures September 2013 September 2012 Maximum temp ºC 26.4 24.9 Mean max temp ºC 18.63 18.73 Days max temp >20ºC 8 10 Days max temp >15ºC 24 27 Minimum temp ºC 5.9 4.9 Mean min temp ºC 10.4 8.85 Days min temp <10ºC 15 22 Rainfall mm 53.8 43.3 Days with rainfall 15 12 33 year average rainfall 60.36mm Driest September since 1981 1997 with 8.3mm Wettest Sept since 1981 1999 with 125.3mm
Gary Beynon
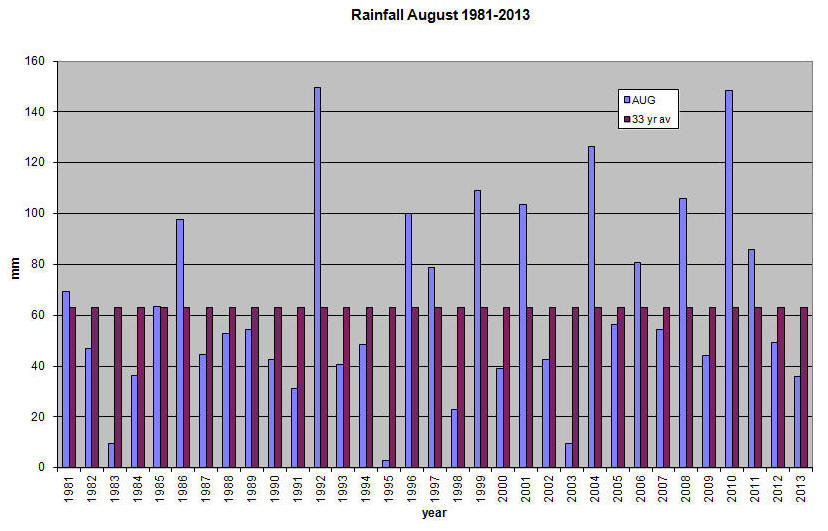
I thought on Friday (30th) that August was to be a month when the maximum temperature did not fall below 20ºC and the minimum was going to be above 10ºC. The last day let me down with both the figures; maximum dropped to 19.9 and the minimum to 9.6. It was a pleasant month with high temperatures at the start and good levels throughout. Overall the rainfall was very similar to July and June and only half the 33 year average. However there was rain to record on 15 of the days. August has been quite a reasonable month more times than not. In the last 33 years rainfall has been below the average in 21 of the years. This August was the driest since 2003. Compared with August 2012, this year was very similar. The farmers should be happy as many of the crops have been harvested; I have yet to hear of the yields.
The facts and figures August 2013 August 2012 Maximum temperature ºC 31.1 29.0 Mean max temp ºC 23.18 22.93 Days max temp > 20ºC 30 28 Minimum temperature ºC 9.6 6.5 Mean min temp ºC 13.1 13.24 Days min temp < 10ºC 1 2 Days min temp < 15ºC 25 25 Rainfall mm 35.8 49.1 33 year average rainfall mm 63.12 Days with rainfall 15 17
Rainfall chart for August
Gary Beynon
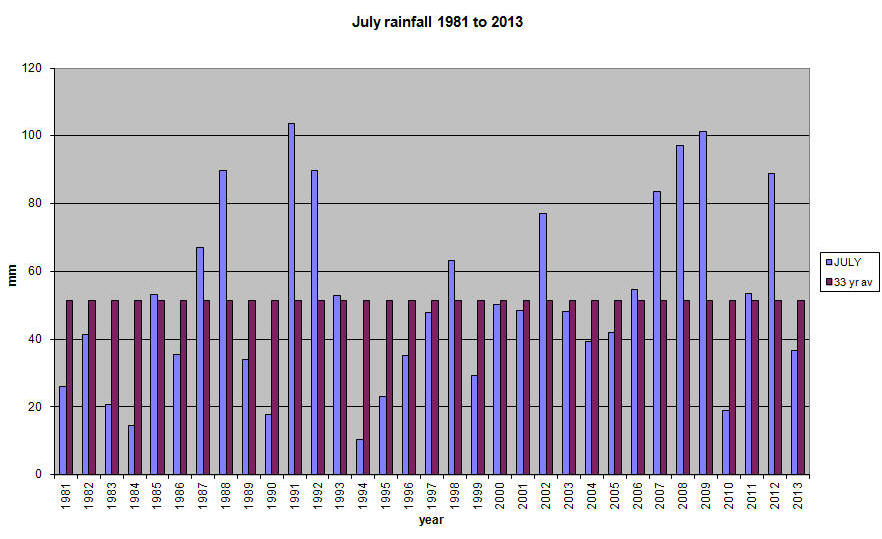
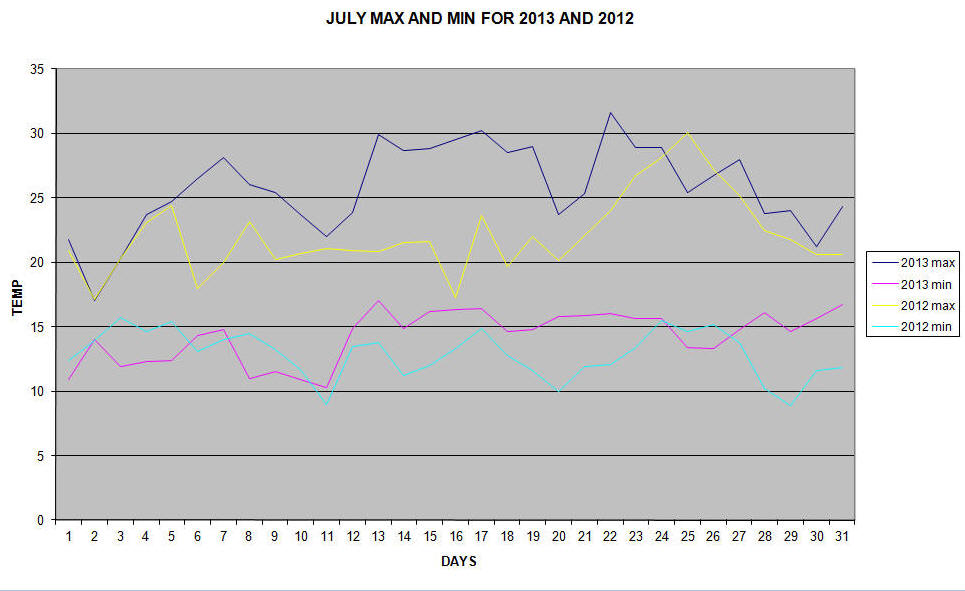
At one stage late in the month it looked as if we were going to have the driest July since I have been taking measurements. Not so; the last 8 days made sure of that. It was a warm-should we say hot?- month with temperatures on average way up on last year and a maximum above 30ºC on 2 days with an average maximum of greater than 25ºC. The grass on our lawns is still ample proof of the warmth and dryness. August has at least started in the same hot way; will it continue?! Rainfall was below the 33 year average but July is a month of big contrasts. Over the last 33 years, rainfall has been below average in 23 of the years and above therefore in 10. When it is wet in July it really is wet. Facts and Figures July 2013 July 2012 Maximum temperature ºC 31.6 30.1 Mean max temp ºC 25.79 22.11 Days temp > 30 ºC 2 1 Days temp > 25 ºC 18 5 Minimum temp ºC 10.3 8.9 Mean min temp ºC 14.28 12.89 Days temp <15 ºC 19 27 Rainfall mm 36.6 88.9 Days with rainfall 10 22 33 year average rainfall mm 51.39
Rainfall chart
Gary Beynon
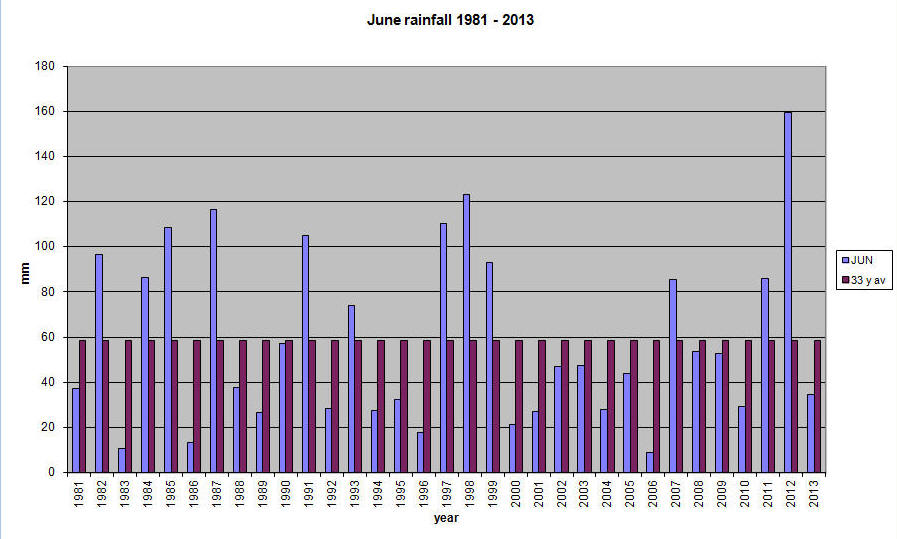
June was a sandwich month; dry at the start and end with rain as the filling. There was a hope that summer had arrived early on but the hopes were dashed by cloud and rain through the middle weeks. The latter part of June started to give promise of decent weather which, we now know, has lasted well into July. Even though rain was recorded on 14 days, there wasn’t a great deal with the total well below the 33 year average. Looking back over the last 33 years the rainfall is very variable with 12 years greater than average and 21 below. The extremes are dramatic with a low of 8.8 mm in 2006 and a high of 159.6 mm in 2012 compared with the 58mm average. 2012 was very wet but warmer and 2011 was wet (not as wet as 2012) and warmer again. Looking for patterns is nigh on impossible.
Facts and figures June 2013 June 2012 Max temp ºC 25.0 28.1 Mean max temp ºC 19.99 20.27 Min temp ºC 6.7 6.1 Mean min temp ºC 10.48 11.09 Days max > 20ºC 16 20 Days min < 10ºC 14 7 Rainfall mm 34.5 159.6 Days with rain 14 23 33 year average rainfall mm 58.41
Rainfall chart for June 1981 to 2013
Gary Beynon
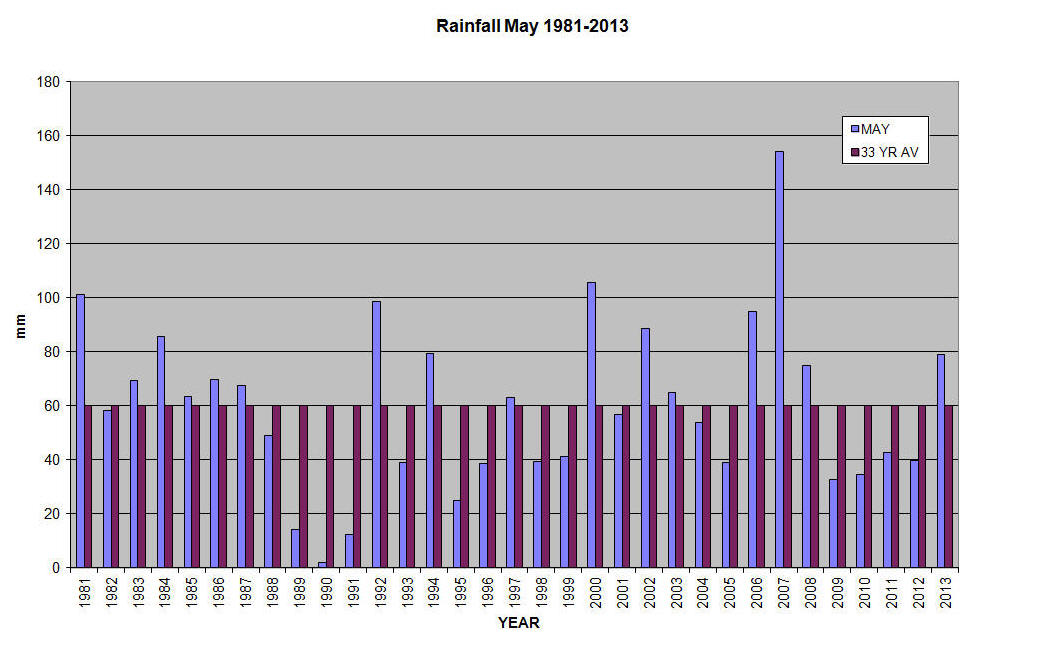
Another grey month that most of us would probably prefer to forget. The garden plants stood still, the central heating was on more often than not, any ideas about a warm Spring were soon dispelled and the brief appearances of the sun were really welcome. At least the weather for fête day wasn’t as bad as it could have been and people turned up in their hundreds. Unfortunately a storm over Luton stopped the flypast but we were lucky to miss the downpour. The Met Office have reported that this was an unusually cold May; their data is from the whole country and averaged so our own experience in Hyde Heath is unlikely to mirror their findings in detail. Spring officially lasts from March to May and comparisons are made over these months. Any variation in the average temperature is going to be significant when you bear in mind that the totals are divided by 92 (number of days from March to end of May). Over the last 3 years the average maximum temperature fell from 16.84 to 12.35ºC and the minimum from 6.46 to 3.96ºC. Conclusion: yes it was cold! The good news is that as I write this, the sun is shining and the outlook is good; long may it continue.
A mass of figures May 2013 May 2012 Maximum temp ºC 22.4 26.8 Average max temp ºC 16.82 18.68 Days max >15 23 22 Days max >20 3 10 Minimum temp ºC 2.8 2.7 Average min temp ºC 7.22 9.1 Days min <5 4 5 Days min <10 26 20 Days with frost 1 1 Rainfall mm 78.9 39.8 33 year av rainfall mm 59.87 Days with rainfall 21 11
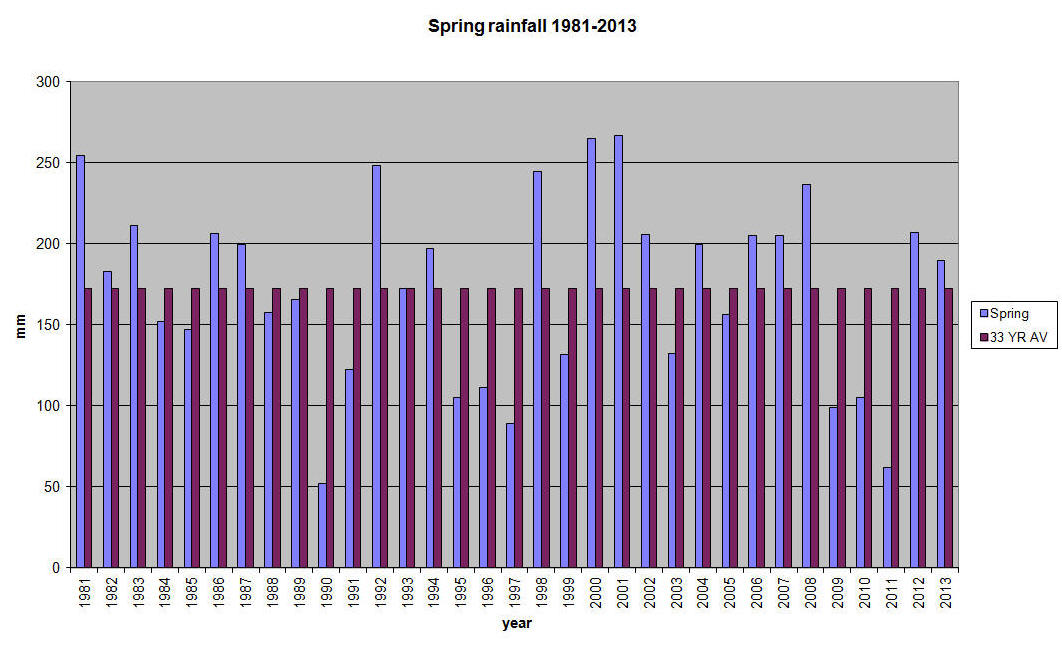
Spring data over the last three years : 2011 2012 2013 Average daily max temp over 92 days 16.84 15.3 12.35 Average daily min temp 6.46 5.91 3.96 Rainfall 61.7 207 189.7 33 year average rainfall 172.11
Gary Beynon
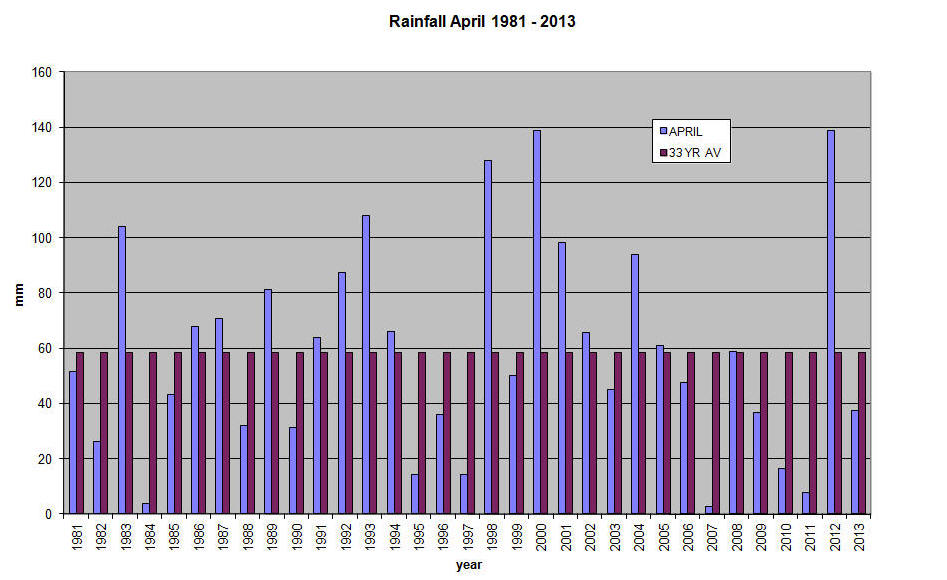
What is a typical April as far as the weather is concerned? The old notion would be showers and relatively mild. But we have had snow in April, very heavy prolonged rain and, in contrast, warm early summer temperatures. There probably is no “typical” April. This last April was a mixture; it was dry but that’s not unusual (since 2000 there have been 7 years below average rainfall and 4 with up to twice the average), the temperatures varied in the day from a high of 21.6 to a low of 4.1ºC and night temperatures from -1.6 to 10.8ºC. The variation over the month was also marked; cold to start with, then the last 3 weeks much milder. The skies were often clear at night so that despite good daytime temperatures there were frosts and near freezing temperatures over night. Compared with April last year, temperatures were similar but last April was much wetter.
The facts and figures April 2013 April 2012 Maximum temperature ºC 21.6 18.6 Mean max temp ºC 13.67 13.65 Days above 15 ºC 13 2 Minimum temperature ºC -1.6 -0.6 Mean min temp ºC 4.01 4.64 Nights below 5ºC 18 17 Day temps below 10ºC 5 1 Rainfall mm 37.5 138.7 33 year average rainfall mm 58.46 Days with rainfall 14 25
Rainfall chart
Gary Beynon
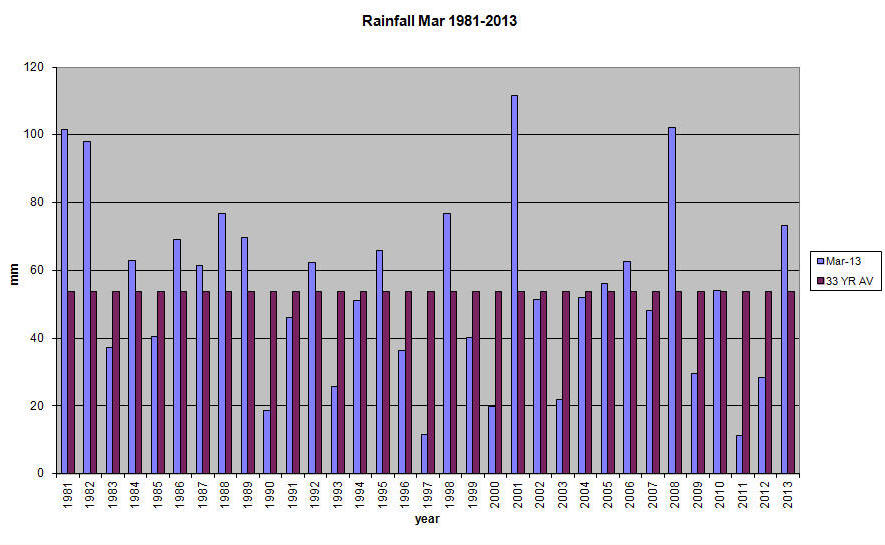
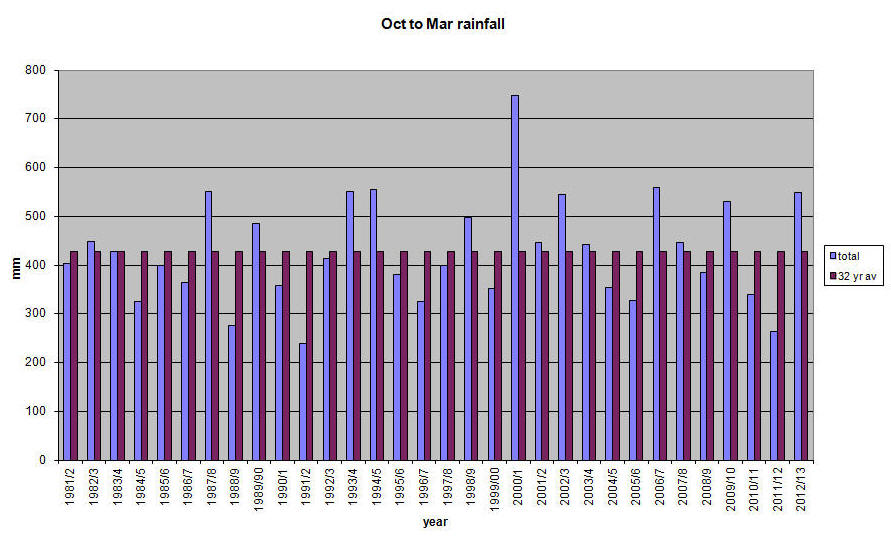
Cold, wet, horrible; any other adjectives you might like to use? It was significantly colder and wetter than March 2012. Perhaps more so is that March was a miserable month; predominately a cold easterly wind with very little sunshine. There were a few days early on when the temperatures soared to 13.6ºC but it didn’t last. There were many frosts even if the humidity has been low enough on many of those days to keep ice off the windscreens. Then there was the snow! All one can say is that we were so much better off than many. Rainfall was above the 33 year average and closed a 6 month period of well above average rainfall. There cannot be a reason this year for water restrictions; not a valid one anyway. Over the last 32 winters this has been the 6th wettest with about 25% more rainfall than the average. It is just as well that the 3 months of this year were not as high as October to December last year though or we could have been swimming even in Hyde Heath. Rather depressingly April has started on the same cold, lack lustre tone; let us hope for an improvement.
Facts and Figures March 2013 March 2012 Maximum temperature ºC 13.6 19.5 Mean max temp ºC 6.6 13.96 Days > 10ºC 4 29 Minimum temperature ºC -3.4 0.8 Mean min temp ºC 0.64 4.11 Days with frost 19 8 Rainfall mm 73.3 28.5 Days with precipitation 15 5 Days with sleet/snow 9 0 Average rainfall over 32 years mm 53.78
Rainfall October 2012 to March 2013 549.1mm Rainfall October 2011 to March 2012 263.4mm Average over last 32 years 428 mm
Rainfall chart March 1981 to 2013
Gary Beynon
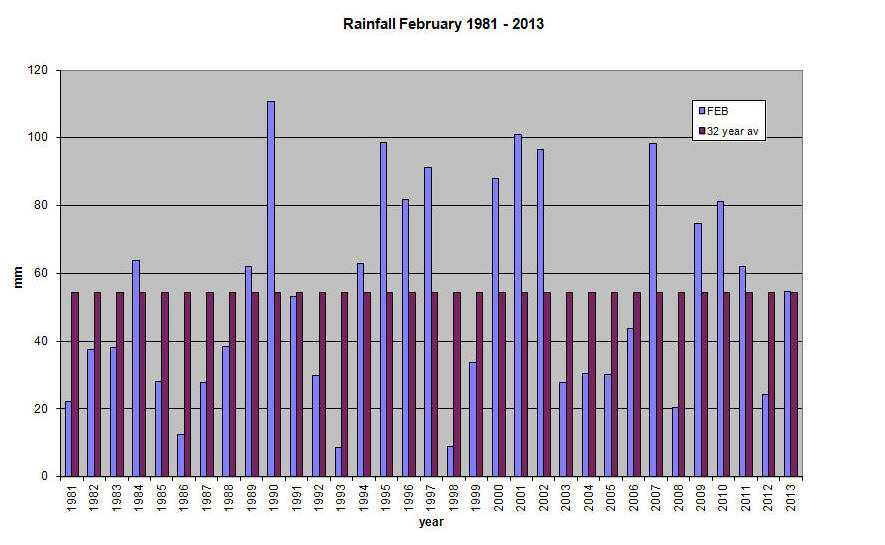
A real mixture of weather sums up February 2013. There were long periods of sunny days, long periods of cloudy days, many nights with frost, over half the days with more or less rain and also days with snow or sleet. I suppose it was February so what can you expect?! Compared with last year it wasn’t as warm, it didn’t get as cold, it was wetter (but 2012 was a dry winter) and there was more snow. The rain we had was very heavy in the second week of the month and made the ground saturated again; this made it difficult for farmers and gardeners alike to do very much. I hear that the winter cereal (sown in the Autumn) has not done that well due to the conditions and costs for Spring sowings are going to be higher than last year making the economics of it all dubious. Let us hope that the Spring and Summer hold a promise of good weather!
Facts and figures 2013 2012 Maximum temperature ºC 10.5 15.5 Mean max temp ºC 6.0 7.76 Minimum temperature ºC -1.4 -8.7 Mean min temp ºC 0.98 1.31 Days max temp > 10 ºC 3 13 Days min temp < 0 ºC 16 12 Rainfall mm 54.6 24.4 Days with snow/sleet 8 2 Days with precipitation 18 8 32 year average rainfall mm 58
Rainfall chart
Gary Beynon
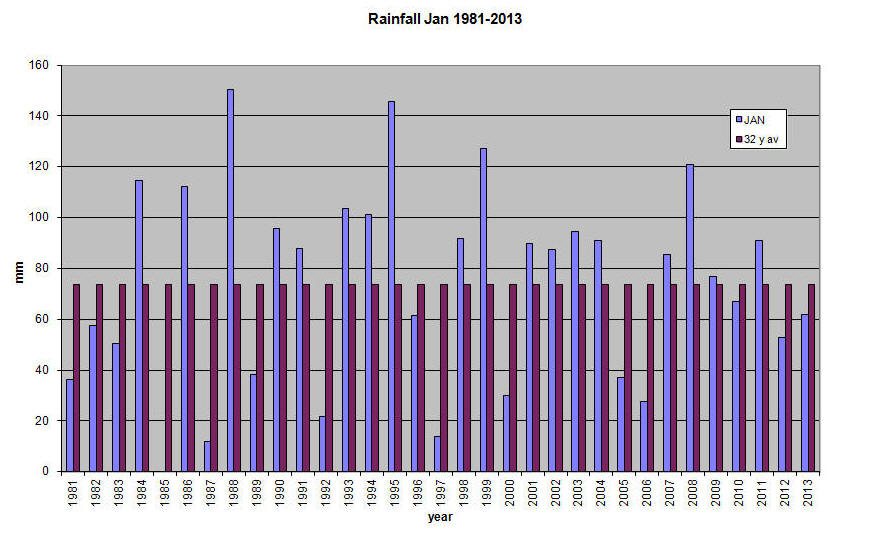
January was a grey, wet, cold and unpleasant month. There was nothing to dry out the ground which remains wet at best and waterlogged in many places. It was wet in Bucks but further west, in Gloucestershire for example, it has been, and is, even wetter. Most of the fields there have standing water. Things have yet to improve for our farmers The middle of this month (February) sees the allowed start of ploughing of winter set aside; if they can get on the land. The rainfall was actually below the average for January but everything that did come down was onto already saturated ground. Lots of wet days, many days when there was frost and 8 days with some snow. All that to be contrasted with a high of 12.9ºC (a low of -5.5ºC) at the end of the month. In fact it was a temperature sandwich; the first 10 days were mild, then 15 days of near zero temperatures followed by 6 days of double digit figures. The facts and figures January 2013 January 2012 Maximum temperature ºC 12.9 11.9 Mean max temp ºC 4.67 8.69 Days max > 10ºC 8 13 Minimum temperature ºC -5.5 -2.1 Mean min temp ºC 1.91 2.79 Days min < 0ºC 12 8 Rainfall mm 62 52.7 31 year average rainfall mm 73.79 Days with precipitation 19 19 Days with snow/sleet 8 0
Rainfall chart for January 1981 to 2013
Gary Beynon |
|||||