 |
Hyde Heath Weather 2012 |
 |
 |
|
|
Hyde Heath Weather 2012 |
|
|
|
Weather reports by Gary Beynon based on his own observations & measurements
|
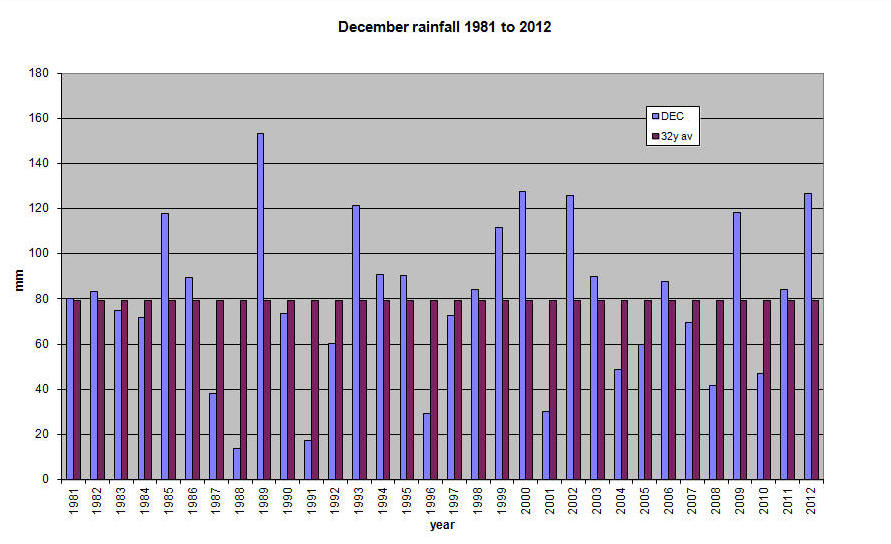
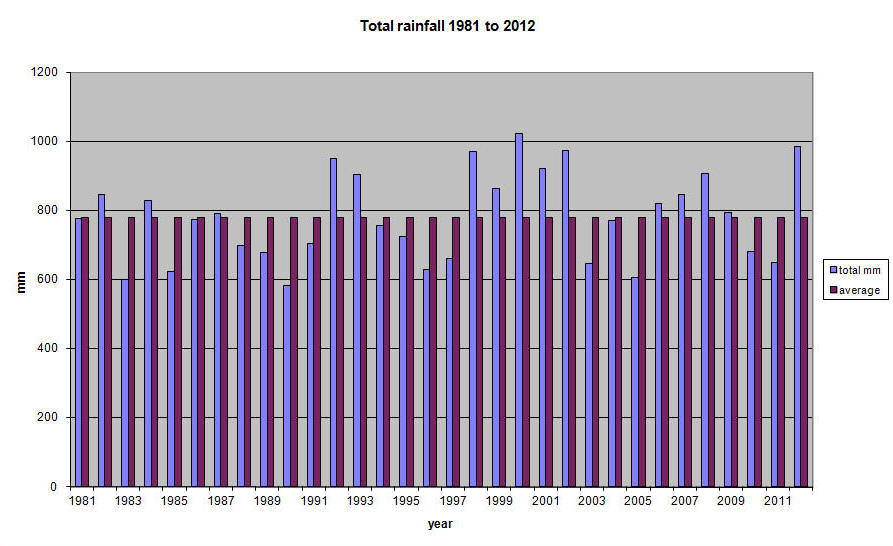
December 2012 and the year 2012 The UK has had the wettest year since records began. That is not the case in Hyde Heath; we have had a wet year but the year 2000 was wetter in this part of the country. Even the last 3 months, October to December, although wet were beaten by the corresponding months in 2000 and 2002. Not that these records are anything to be pleased about! Many farmers failed to plant the winter corn and are now hoping for a dry Spring to be able to make up time. The ground, as I am sure I do not need to tell you, is saturated. At long last even the lake opposite the Chiltern Hospital has water in it and it is following into the Misbourne. December was a dreary month with a cold spell at the start with 11 days with a frost recorded, and 2 days when we saw snow for a short time. Then all change; the second half of the month was a deal milder and WET. The last 19 days had more or less rain and often it was in the “more” category. From a temperature point of view, December was not dissimilar from 2011.
The facts and figures. December 2012 December 2011 Maximum temp ºC 12.5 12.7 Mean max temp ºC 7.65 8.71 Days max > 10ºC 7 14 Minimum temp ºC -4.9 -0.5 Mean min temp ºC 2.29 3.41 Days min < 5ºC 25 24 Days with a frost 11 11 Rainfall mm 126.5 77.6 Days with rain 26 24 Dec 32 year av mm 79.125 32 year av rainfall for year mm 780.87 2012 rainfall mm 984.2
Oct to Dec rainfall mm 2012 359.2 2002 400.3
2000
445.8 32 year av 246.8 Rainfall charts for December 1981 to 2012 and the years 1981 to 2012
Gary Beynon Jan 1st 2013
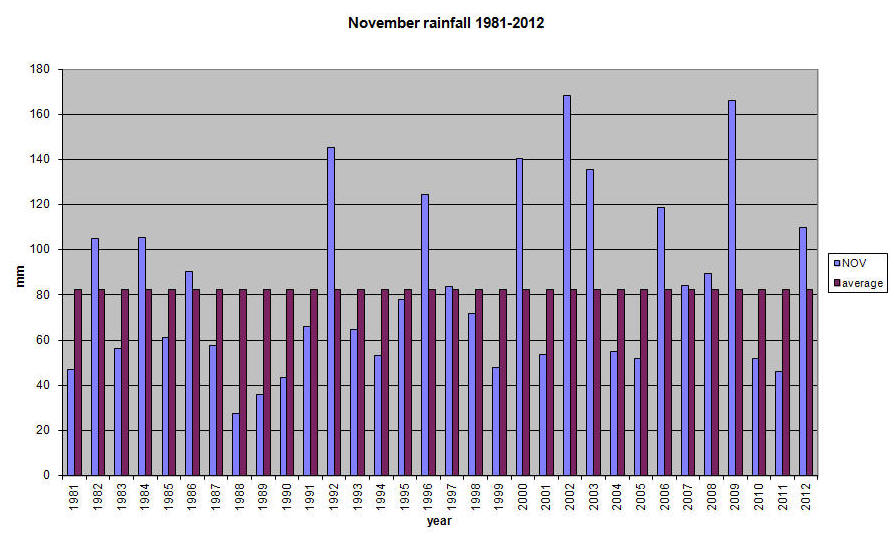
November was a wet month with about 30% more rainfall than the average. It was significantly wetter than November 2011 with well twice the amount. It rained on about the same number of days but some of the wet days were really wet with between 12 and 19 mm (½ to ¾ inch); one day in 2011 gave 24.3mm! This was after a wet October that had already saturated the ground so that most of the November rainfall flowed into the water courses. Surprising that there is no water in the lakes between Missenden and the Chiltern Hospital; how much is abstracted by the water company?? Many of the fields that should have been sown with winter wheat etc have been too wet to get on. Temperature wise it was colder than last year with more noticeable frosts and lower maximum temperatures. This morning (5th December) we woke to a covering of snow; let’s hope it was the first and last. Facts and figures November 2012 November 2011 Maximum temperature ºC 13.7 16.1 Mean max temp ºC 9.50 12.35 Days > 10ºC 14 26 Minimum temperature ºC -1.4 0.4 Mean min temp ºC 3.70 6.75 Days < 5ºC 20 7 Rainfall mm 109.8 46.2 Days with rain 20 19 32 year average rainfall 82
Rainfall chart
Gary Beynon Dec 6th 2012
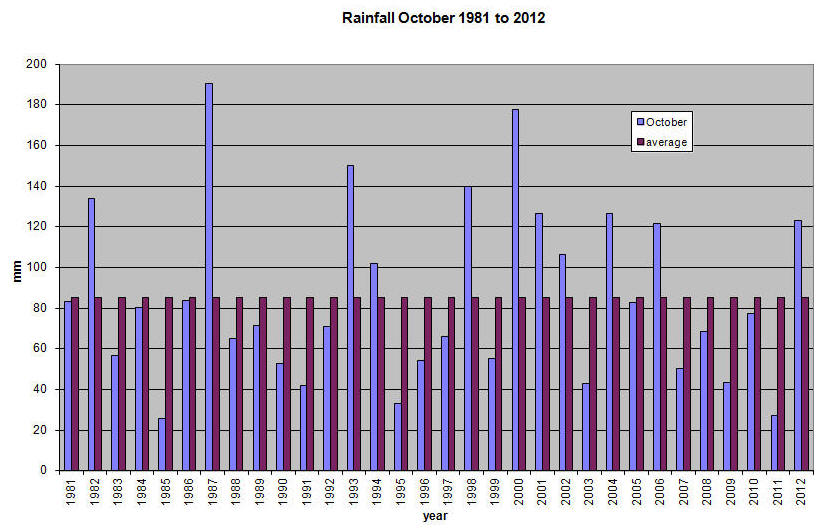
October was a wet month; did you really need reminding? However not as wet an October as we have had in past years and not the wettest month this year. Two months actually had more rainfall than this October; April with 138.7 mm and June with 159.6 mm. What is very evident is that the rain has saturated the ground. Many of the local farmers have still to drill the winter wheat which in past years has been completed by the end of September. It was a mild month although the overnight temperatures did fall low enough to give frost on the tops of the cars on two occasions. The end of the month was the least pleasant with a lot of cloud during the last two weeks; 13 days when I wrote down as mainly cloudy. Saturday 27th saw snow flurries early in the morning—nothing much but snow nevertheless. The facts and figures: October 2012 October 2011 Maximum temperature º C 17.2 24.3 Mean max temp º C 13.47 16.52 Days max > 20º C 0 3 Days max > 15º C 10 21 Days min < 10º C 26 19 Days with “frost” 2 1 Minimum temperature º C 1.2 3.2 Mean min temp º C 6.96 8.93 Rainfall mm 122.9 27.2 32 year average mm 85.3
Rainfall chart 1981 to 2012
Gary Beynon Nov 6th 2012
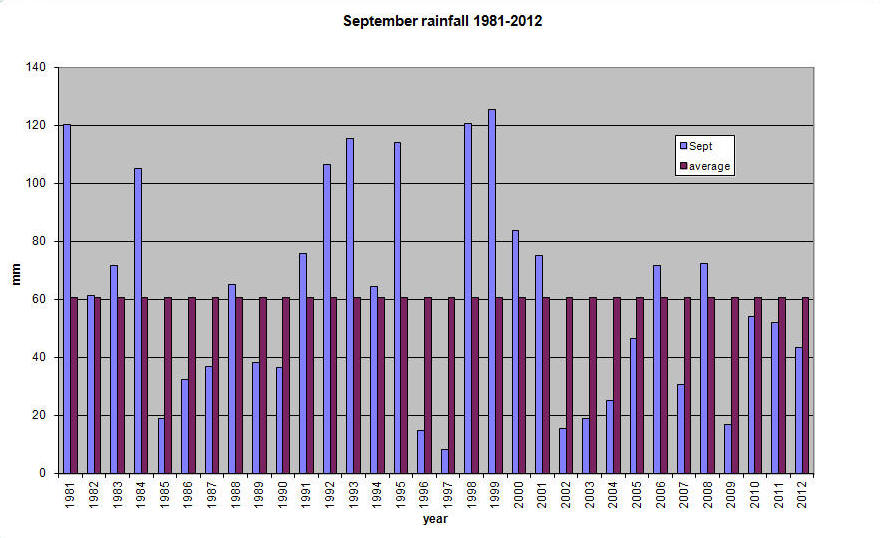
September was a month of two parts; the first 3 weeks were mainly dry quite warm and reasonably sunny, the last week was wetter, cooler and far less pleasant. Most of the rainfall came in just 3 consecutive days with 75% of the month’s total falling. It was a month with below average rainfall but as can be seen from the chart below, the rainfall pattern during September is extremely variable. Overall it was a month very similar to last year. The figures: September 2012 September 2011 Maximum temperature ºC 24.9 24.5 Mean max temp. ºC 18.73 19.94 Days > 20ºC 10 12 Minimum temperature ºC 4.9 7.0 Mean min temp. ºC 8.85 11.07 Days < 10ºC 22 9 Rainfall mm 43.3 52.2 Days with rainfall 12 16 32 year average rainfall 60.56
Rainfall chart
Gary Beynon Oct 6th 2012
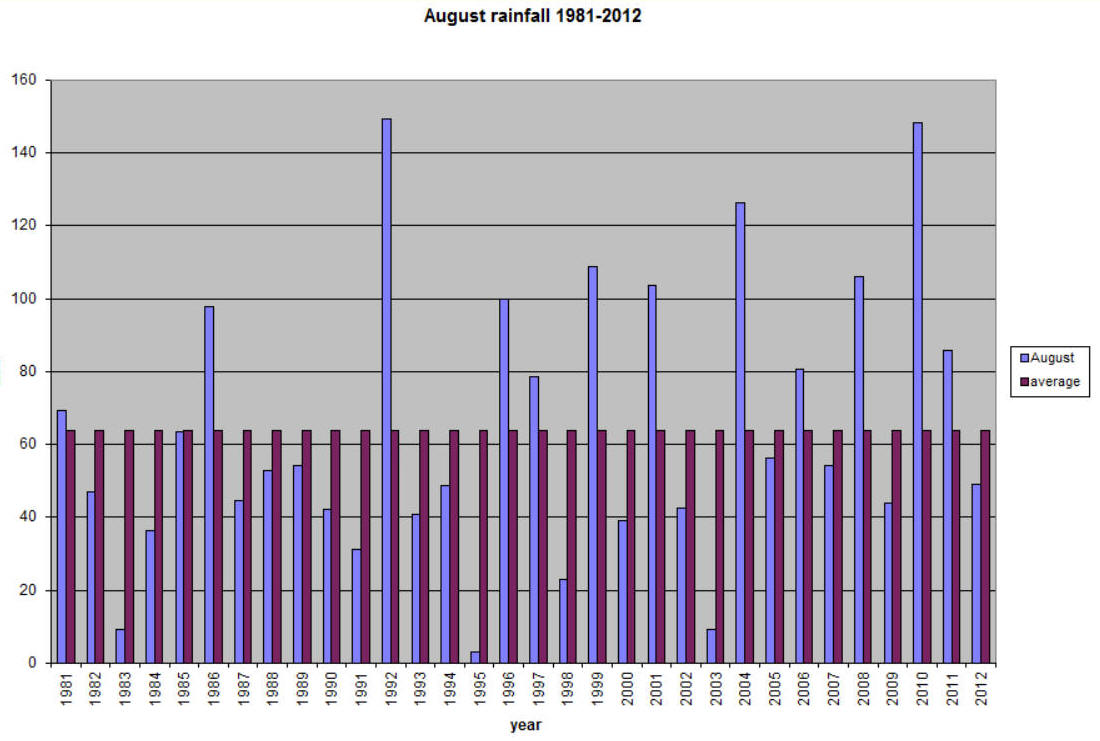
Not a bad month but not
that good either. August on average is not a “summer” month as we all
hoped with high average rainfall and moderate temperatures. The indicator
this year was how long the farmers had to wait before they could start
harvesting; the first week was wet, then a short drier spell followed by
just enough rain to keep the crop wet and things not really getting into
full swing until the beginning of September. I hear that yields are well
down and that quality is not high; all an indication of the poor weather
during the growing season. Facts and figures August 2012 August 2011 Maximum temperature ºC 29.0 28.5 Mean max temp ºC 22.93 21.27 Days >25 ºC 7 3 Days >20 ºC 28 23 Minimum temperature ºC 6.5 8.5 Mean min temp ºC 13.24 12.03 Days <10 ºC 2 4 Rainfall mm 49.1 85.8 Days with rain 17 20 32 year average mm 63.98 Rainfall graph
Gary Beynon Sept 5th 2012
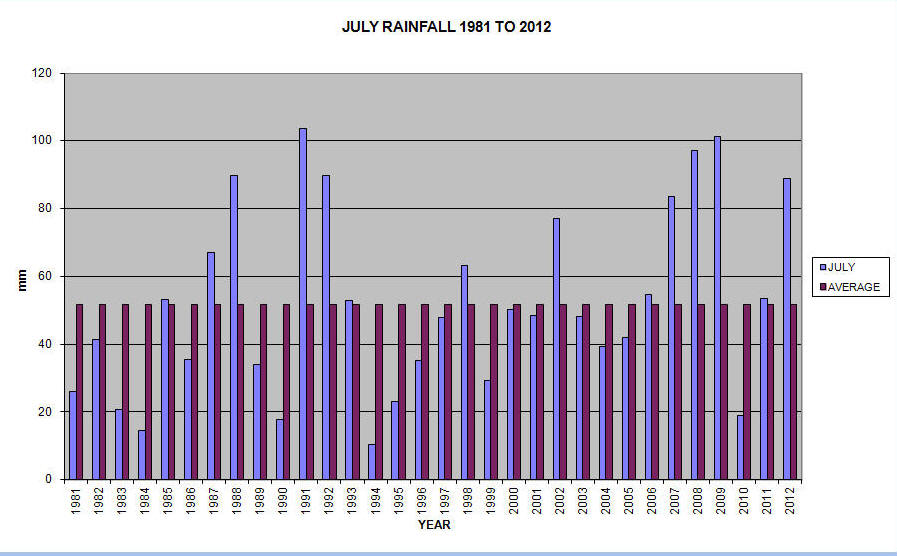
9 days without rain and just 5 days when the maximum temperature exceeded 25ºC; that was July that was. Really nothing to write home about but will we remember the wet or just those 9 days when the jet stream moved north and we briefly had a taste of summer? This is usually a month when much of the harvest is brought in; I understand that the winter wheat is still at least 2 weeks away from being ready and hay is going to be a nightmare. We only have to look at our own gardens to see the lack of flowers blooming, the amount of greenery and, if you really want to be depressed, the number of slugs and snails that are feasting on what little there is. A report in the Telegraph compared the year of the last Olympics in this country with this year; apparently 1948 was incredibly similar. August that year wasn’t much good—BUT they hastened to add, this was not a forecast! July 2011 was better with just average rainfall on half the days of this year and temperatures actually not dissimilar. We have of course been much better off than many parts of the UK who have suffered some really awful weather.
The figures 2012 2011 Maximum temperature ºC 30.1 27.1 Mean max temp ºC 22.11 22.36 Number of days > 20ºC 27 27 Number of days > 25ºC 5 5 Minimum temperature ºC 8.9 9.2 Mean min temp ºC 12.89 12.27 Number of days < 15ºC 27 28 Rainfall mm 88.9 53.6 32 year average rainfall mm 51.85 Days with rain 22 13
Gary Beynon August 2nd 2012
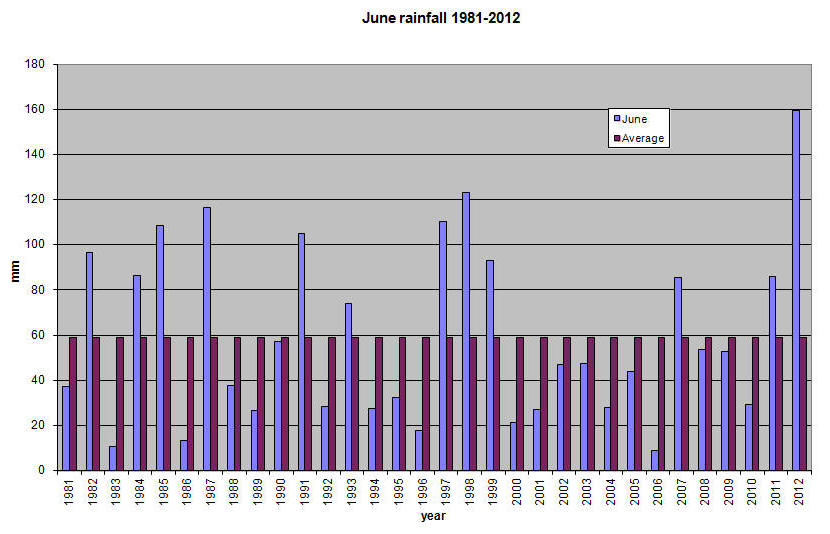
Do I need to tell you that June was the wettest June month in 32 years (at least) in Hyde Heath and according to the Met Office figures was the wettest in the country overall since their records began in 1910? We had an awful lot of rain; some 160mm in fact, that’s over 6 inches in old money. We have an average figure for a whole year of 774.31 mm. Compared with some parts of the country we got off rather lightly as the news pictures of flooding show. It actually rained on 23 of the 30 days of the month. It was hardly a June month as far as temperatures were concerned either. Yes we had a barmy day when it went up to 28ºC but another day when we managed just 12ºC. I think that we are all glad to see the back of June. However, as I type this it is raining again. What hope for July---wait and see. The facts and figures
June 2012 June 2011 Maximum temperature ºC 28.1 30.3 Mean max temp ºC 20.27 21.37 Minimum max temp ºC 12.0 14.8 Minimum temperature ºC 6.1 5.9 Mean min temp ºC 11.09 10.7 Rainfall mm 159.6 86.1 32 year average monthly rainfall mm 59.16 Average rainfall in a year mm 774.31 Wettest month I have recorded October 2000 177.8mm Days of June rainfall 23 22
Rainfall chart
Gary Beynon July 2nd 2012
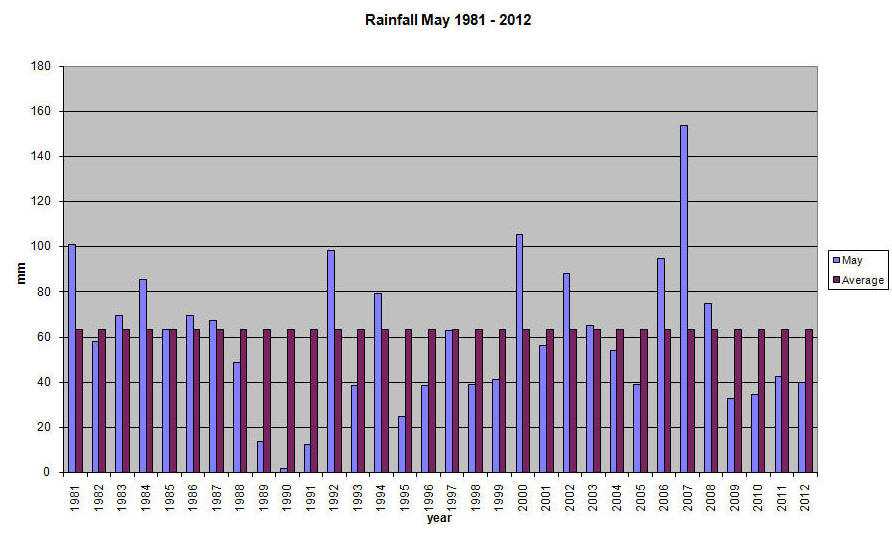
May was a month of two halves; the first 18 days were cooler and contained all the rain, the last 2 weeks were generally a good deal warmer and rain free. You will already have noticed that the start of June has more than made up for the lack of rain at the end of May! Looking back over the years, May has been generally dry with the occasional really wet month, but the last four years have seen rainfall a good way below the average. We did not have any frosts but the temperature did go down to 2.7ºC on the 6th . In contrast there was a high of 26.8ºC on the 28th . May did no good to the water table but June has already made up for it with more rain in 10 days than the 34 year average for the whole month of May. Ironic if the hosepipe ban is lifted when the last thing any of us need to do is to water the garden. Compared with May in 2011, this May was similar in terms of rainfall, maximum, minimum and mean temperatures. The figures May 2012 May 2011 Maximum temperature ºC 26.8 24.8 Mean max temp ºC 18.68 19.74 Minimum temperature ºC 2.7 2.1 Mean min temp ºC 9.10 8.4 Days max above 20ºC 10 13 Days min below 10ºC 20 26 Rainfall mm 39.8 42.6 Days of rain 11 13 Average rainfall 1981 to 2012 63.23mm Wettest May 2007 with 153.9mm Driest May 1990 with 2.0mm
Rainfall chart
Gary Beynon June 11th 2012
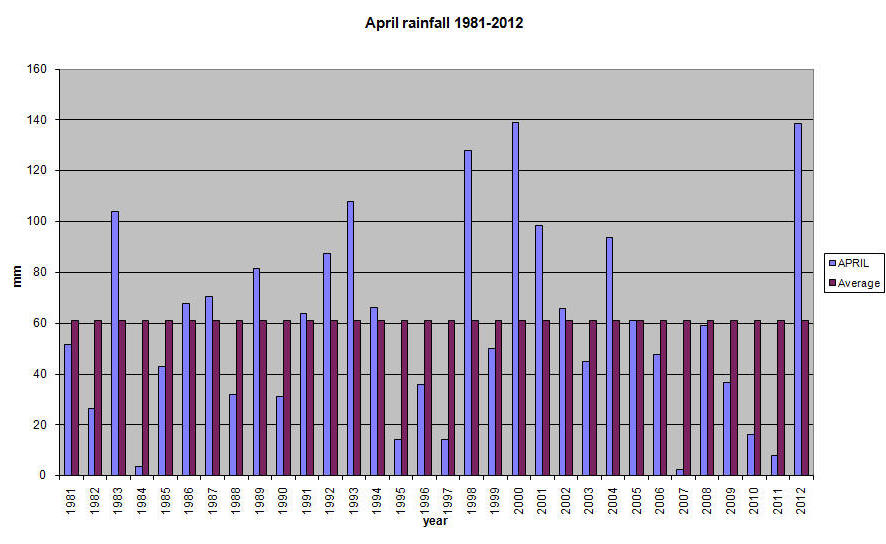
I had worked out the start to this report just before the end of April; it was all about records. Wrong! When the month finally finished we had not broken the rainfall record in Hyde Heath; we missed it by just a fraction of a millimetre. The records being quoted by the Met Office were not be mirrored in our village. The difference I suspect is in the very local showers that made up part of the month; Hyde End could have had more rain than Westfield. That said it was a very wet month especially as the first 3 months of the year were actually so dry. What is a fact is that we had more rain in April than in January, February and March combined (105.6mm). Does all that rain herald an end to the drought and hose pipe ban? No it will not. The problem is that the ground is so hard beneath the surface that the water is not going in and down, much has run off and more will be taken up by the grass and trees. It has been good for the gardens though. The wettest April since records began (in Hyde Heath anyway) was in 2000 when we had 139mm. The year 2000 was also very wet in total with over 1000mm some 30% above our 30 year average; what does the rest of 2012 hold for us? Compared with last year April was cold but 2011 was exceptional.
The facts and figures 2012 2011 Maximum temperature ºC 18.6 25.6 Mean max temp ºC 13.65 19.17 Minimum temperature ºC -0.6 3.8 Mean min temp ºC 4.64 7.53 Days with frost 8 0 Days above 15ºC 6 27 Rainfall mm 138.7 7.8 Days with rainfall 16 7 Wettest April since 1981 139mm in 2000 Average rainfall since 1981 61.02mm
Rainfall graph for April
Gary Beynon May3rd 2012
WEATHER REPORT FOR MARCH 2012 Drought, hose pipes prohibited, rivers running dry, reservoirs low; all characteristics of a prolonged dry period. March again had below average rainfall (as did February) and the rainfall from October 2011 to March 2012 was also a long way short of average. The last 2 periods when the underground aquifers are replenished ie Oct to March 2010/11 and 2011/12, have had just 71% of the average rainfall and the 31 year average is reducing because of the dry winters. In the last 10 years, half the years have recorded below average winter rain. This last winter rainfall has been the lowest since the 1990/01 period. Bottom line is that we are going through a dry period. (Cue—watch out for deluges in the near future!!). Dry certainly, mild as well. The average maximum temperature this March was 2.2ºC higher than last year. At the end of March we had 14 consecutive days with no rain and 10 of those days were virtually unbroken sunshine. What does this say for the summer? Wait and see! As I write this on April Fools’ Day, the forecast is for snow on Tuesday and Wednesday of this week; what a contrast. Facts and figures : March 2012 March 2011 Maximum temperature ºC 19.5 17.1 Mean max temp ºC 13.96 11.7 Minimum temperature ºC 0.8 -2.1 Mean min temp ºC 4.11 3.48 Days with frost 8 8 Rainfall mm 28.5 11.3 Days with rain 5 12
Gary Beynon April 1st 2012
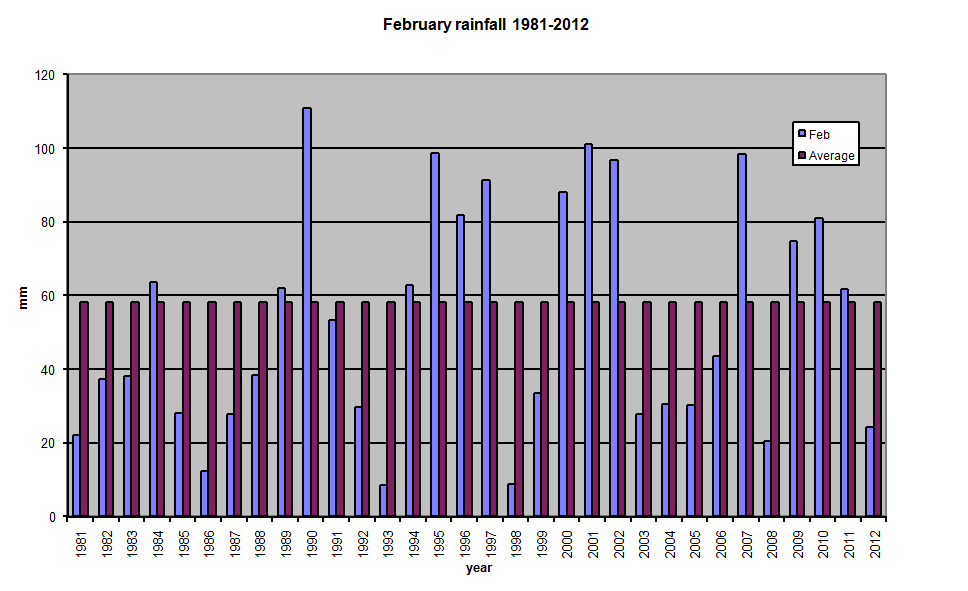
February was yet another dry month with well below average rainfall. The “wet” months of October to March, when our reservoirs are replenished, have not delivered again this year. Last year was below the average and we need a VERY wet March to come up to the mark. This does not seem likely. Not only was it dry but also there was a cold patch with temperatures falling much lower than we have had in Hyde Heath for quite some years. It was not as cold as our neighbours in Chesham who had the dubious distinction of being the coldest in the country on at least one night. Chesham is notorious for frosts being at the end of the same valley with Rickmansworth, a town quoted in the textbooks as having more frosts than many especially for a town this far south. Then the temperatures rocketed and we have seen double figures since the 21st. It has been a very variable month with snow on 2 days, temperatures barely above freezing during the day for a short period and then high values as the month wore on. I am glad that I only attempt to report the weather and not forecast it!
Facts and figures for February 2012 2011 Maximum temp ºC 15.5 13.8 Average max temp ºC 7.76 9.45 Minimum temp ºC -8.7 0.5 Average min temp ºC 1.31 4.62 Days of frost 12 1 Days max > 10ºC 13 11 Rainfall mm 24.4 61.9 Average rainfall in February mm 58.23 Days of rain 6 23 Days with snow 2 0 Average Oct to March rainfall mm 429 Oct to Feb 2011/12 mm 234.9
Gary Beynon Mar 1st 2012
January turned out to be a very cold month with below average rainfall and one of contrasts. The first 11 days saw temperatures around 10ºC during the day with no frost, then 6 days with half the daytime temperature and overnight frost. Then the temperatures rose again and it wasn’t until the last 3 days that we returned to lower daytime and below zero temperatures at night. Although the rainfall was below average, there were 19 days of recordable rainfall. Over the last 32 years, January rainfall has been above the moving average in 17 years and below in the others. 2011 was also a mild January with not dissimilar temperatures, and rainfall was nearly twice this year. Mild Januarys are not unusual; looking back over the past 10 years shows that the month is frequently mild. February has started with something of a sting; it remains to be seen what the whole month will bring.
The facts and figures: January 2012 January 2011 Maximum temperature ºC 11.9 13.1 Average max temp ºC 8.69 6.47 Minimum temperature ºC -2.1 -1.8 Average min temp ºC 2.79 2.18 Rainfall mm 52.7 91.9 Average over last 32 years 81.83 Days with rain 19 23 Days with frost 11 13
|
|
|
| Gary Beynon Feb 6th 2012 |
| Top of page Home |