 |
Hyde Heath Weather 2014 |
 |
 |
|
|
Hyde Heath Weather 2014 |
|
|
|
| Home | Weather 2008/9 | Weather 2010 | Weather 2011 | Weather 2012 | Weather 2013 |
|
Hyde Heath weather reports by Gary Beynon based on his own observations & measurements |
|||||
| January | February | March | April | May | June |
| July | August | September | October | November | December |
|
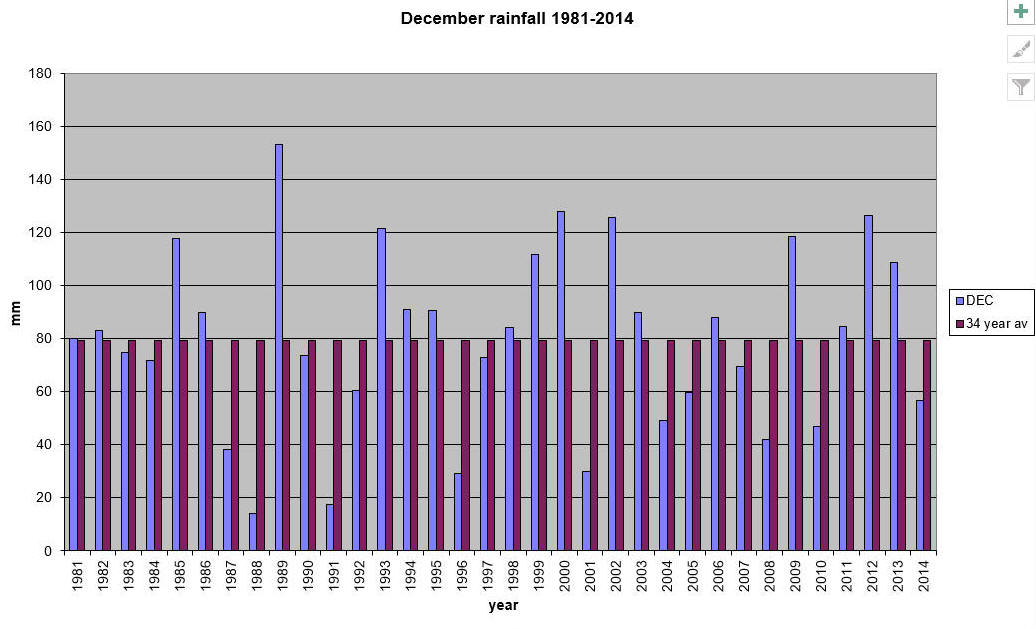
Comparatively speaking,
December was a dry month with the rainfall well below the 34 year average.
Most of the rain fell on just 3 days although there was some precipitation
on many of the days. Pressure was high and temperatures were something of
a rollercoaster. There were days when the temperatures were in double
figures and very little difference over the 24 hour period (22nd
for example when the variation was from 12.3 to 10.0ºC) and others when
the figures were far more what one would expect for December with
overnight frosts and daytime not getting above 3ºC. The winter has started
without much of a sting; long may it continue. Facts and figures
December 2014
December
2013 Maximum temperature ºC 13.0 12.8 Average Max temp ºC 8.13
9.15 Days temp >10ºC
7 9 Days temp > 5ºC 24 31 Minimum temperature ºC -1.1
0.8 Average minimum ºC 8.13 3.42 Days temp 0ºC 5
0 Days with frost (on
windscreen!) 10
6 Rainfall
mm 56.5 108.8 Days with rainfall 18
22 34 year average rainfall
mm
79.33
Rainfall charts:
Gary Beynon
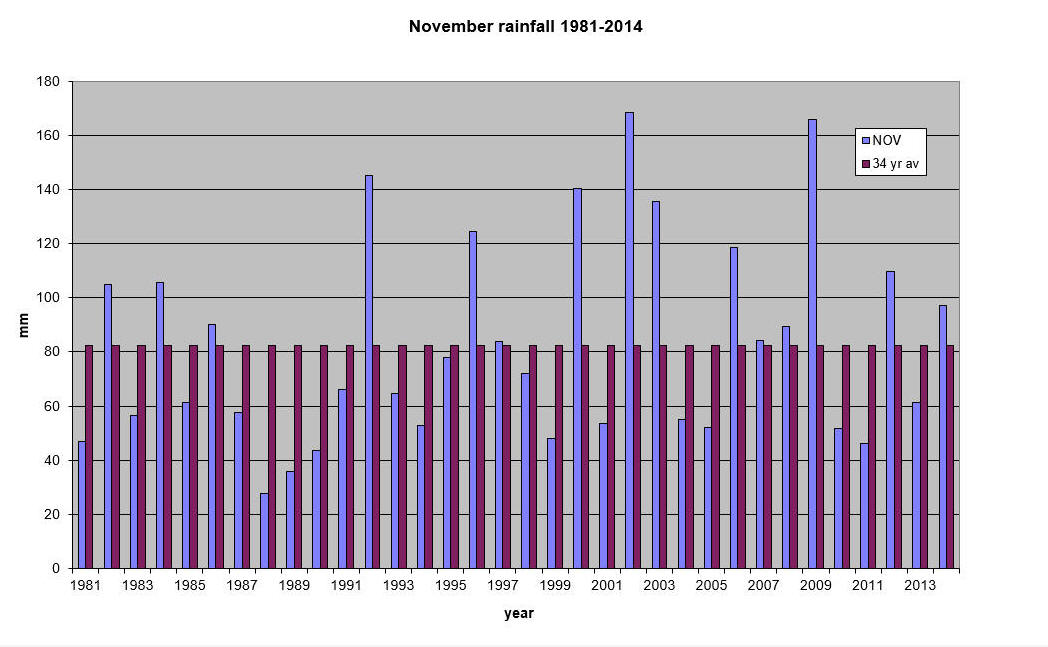
November was wet and mild;
the ground and the amount of water sitting on the surface is evidence
enough. There were few frosts and these affected mostly the car
windscreens with the thermometer not actually dipping to minus. The first
few days were bright but the rest of the month was cloudy, dull and really
rather uninspiring. After a period like that, it is a pleasant surprise to
have sunshine and feel one’s spirits lift. How people much further north
cope with months of not even seeing the sun is remarkable. Compared with
2013, this November was wetter, warmer, less frosty just and very similar
with regards to cloud cover. Facts and figures
November
2014
2013 Maximum temperature ºC
15.4
13.7 Average max temp ºC
11.26
9.17 Days max temp > 10ºC 22
10 Minimum temperature
ºC
0.8
-1.0 Average min temp ºC
6.12
3.82 Days min temp
<5ºC 9
21 Rainfall mm 97.2 61.4 Days with rainfall 24 21 34 year average rainfall mm
82.21 Wettest year
2002 with 168.5mm Driest year
1988 with 27.6mm
Gary Beynon
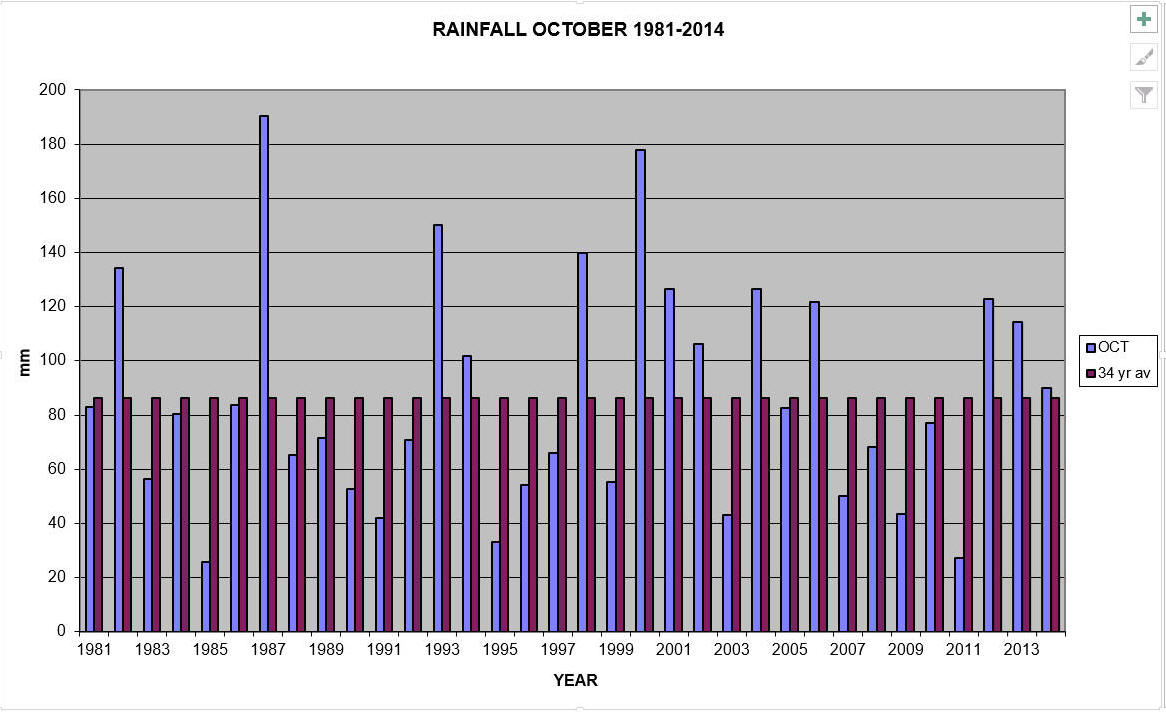
October 2014Warm, wet, frost free, not
that windy and a record maximum temperature on Halloween, made for an
October that has taken us well into the autumn without really bad weather
and makes spring that bit closer. Hyde Heath didn’t quite make 20ºC on the
31st
but at 19.2ºC it was warm
and
some 8-10º above the norm. The seasons do seem to be changing; when I was
young(er) the big thing for Bonfire night was to collect sacks of leaves
for the base as most of the trees were pretty bare; look at them now.
Facts and figures
October 2014
October 2013 Maximum temperature
ºC
20.2
19.3 Average max temp
ºC
15.94
15.37 Days max temp
>20ºC 2
0 Days max temp
>15ºC
19
19 Minimum temperature
ºC
3.7
3.5 Average min temp ºC
9.84
9.64 Days min temp
<10ºC 12
14 Days min temp
<5ºC
2 1 Rainfall
mm 90
114.3 34 year average
mm 86.29 Days with rainfall
22
23 Wettest year
1987 with 190mm Driest year
1985 with 25.9mm Rainfall chart
Gary Beynon
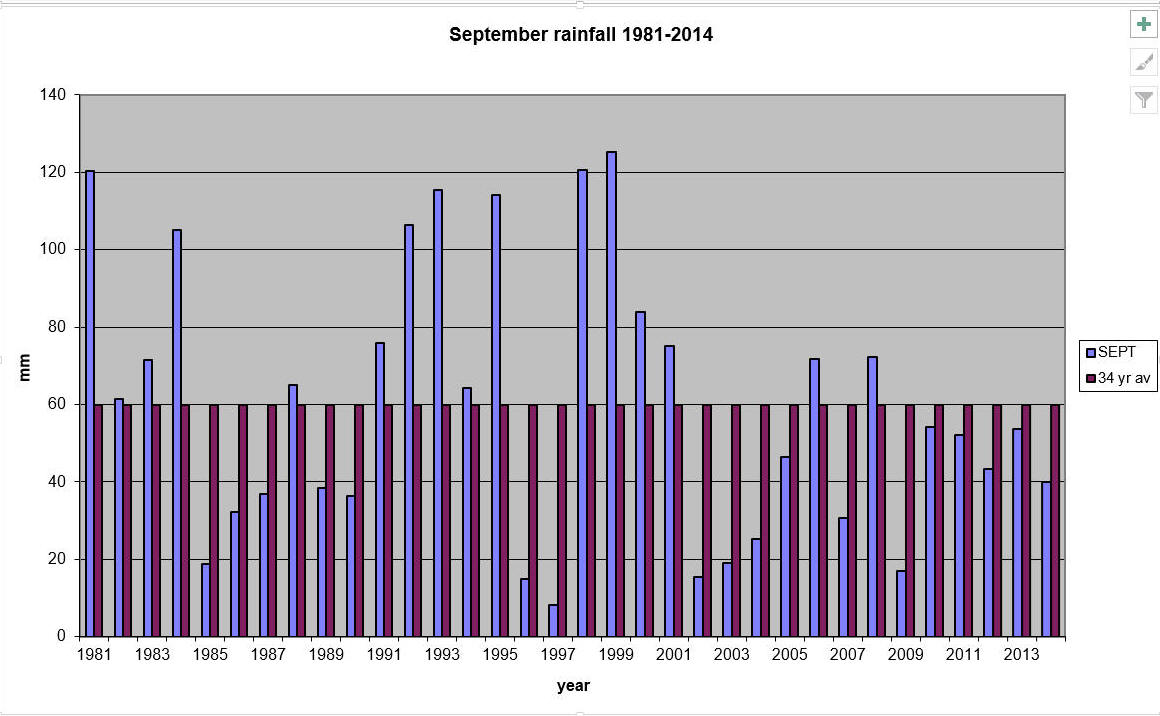
September 2014September was warm, dry and
had quite a lot of sun. Most of the rain fell on just one day, the 19th,
with 33.4 of the total of 39.9mm. We were in The facts and figures
September 2014
September 2013 Maximum temperature
ºC
25.0
26.4 Average max temp
ºC
20.72
18.63 Days max temp >20 ºC
21
8 Minimum temperature
ºC
6.0
5.9 Average min temp ºC
11.33
10.4 Days min temp<10 ºC
10
15 Rainfall mm 39.9
53.8 Days with rain 9
15 Wettest day mm 33.4
21.9 34 year average rainfall
mm
59.76
Gary Beynon
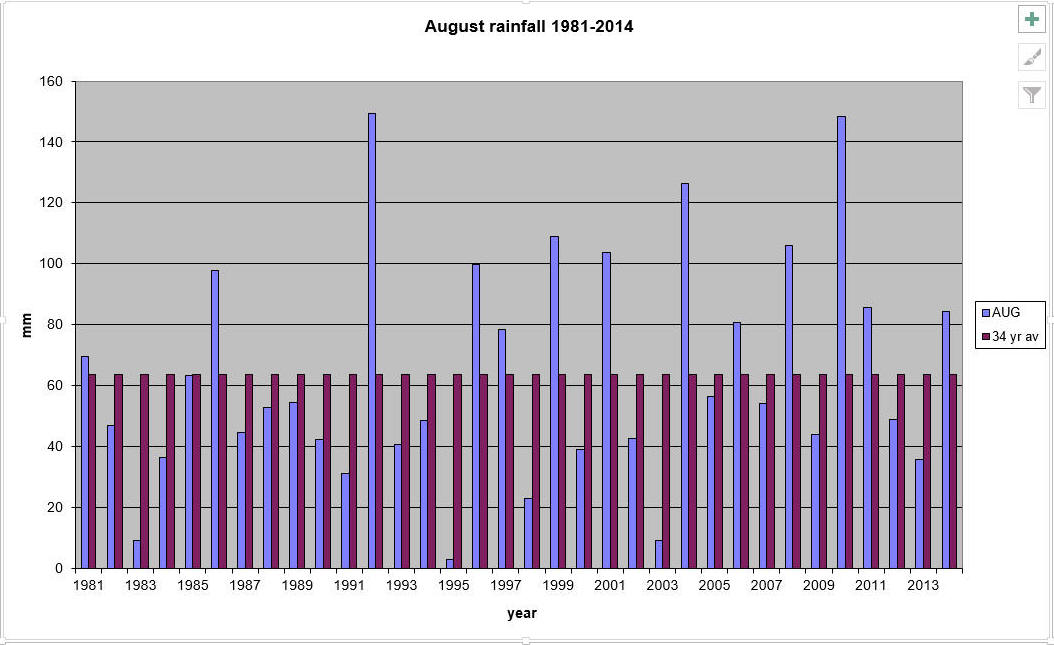
August 2014Compared with last year August was a deal wetter. In 2013 there was below average rainfall and followed 2 previous months of low rainfall. The temperatures this year pleasant but down on 2013; then the maximum temperature only dropped below 20ºC on one day-the 31st. This year 8 days were below that figure with the 25th seeing a rather miserable 16.8ºC with rain all day. When it rained we were
subjected to some heavy downpours with 3 days each having over 12mm (½
inch in old money) and accounting for 50 out of the 84 mm total. So far
September has been dry but the mornings have been getting cooler. A good
year for the harvest; most is in and a good year for apples, sloes, runner
beans and tomatoes---from my perspective anyway. The facts and figures August 2014
August 2013 Maximum temperature
ºC
27.3
31.1 Mean max temp ºC 21.61
23.18 Days max temp >
20º C ºC 23
30 Minimum temperature
ºC 7.7
9.6 Mean min temp
ºC
11.59
13.1 Days min temp < 0ºC ºC 6
1 Days min temp < 15ºC 29
25 Rainfall mm 84.5
35.8 34 year average rainfall mm
63.75 Days with rainfall
20
15 Wettest year
1992 with 149.5mm Years above the average
13 in 34 Rainfall chart for August
Gary Beynon
July 2014July was another dry and very warm month. It
started with rain on many days but the last two weeks were almost without
any rain and consistently warm (even hot!). It is often the case in the Facts and figures July 2014
July 2013 Maximum temp.
ºC
29.3
31.6 Average max temp. ºC
25.55
25.79 Days max temp >25ºC
20
18 Minimum day max
ºC
21
15.6 Minimum temp
ºC
9.7
10.3 Average min temp
ºC
13.85
14.28 Days min temp
<15ºC
22
19 Rainfall
mm
37.2
36.6 Days with rain
12
10 Wettest day
mm
13.5
10.6 34 year average rainfall mm
50.97 Years above average 11 Years below average 23
Wettest July in 34 years
1991 with
103.7mm Rainfall chart
Gary Beynon |
|||||
|
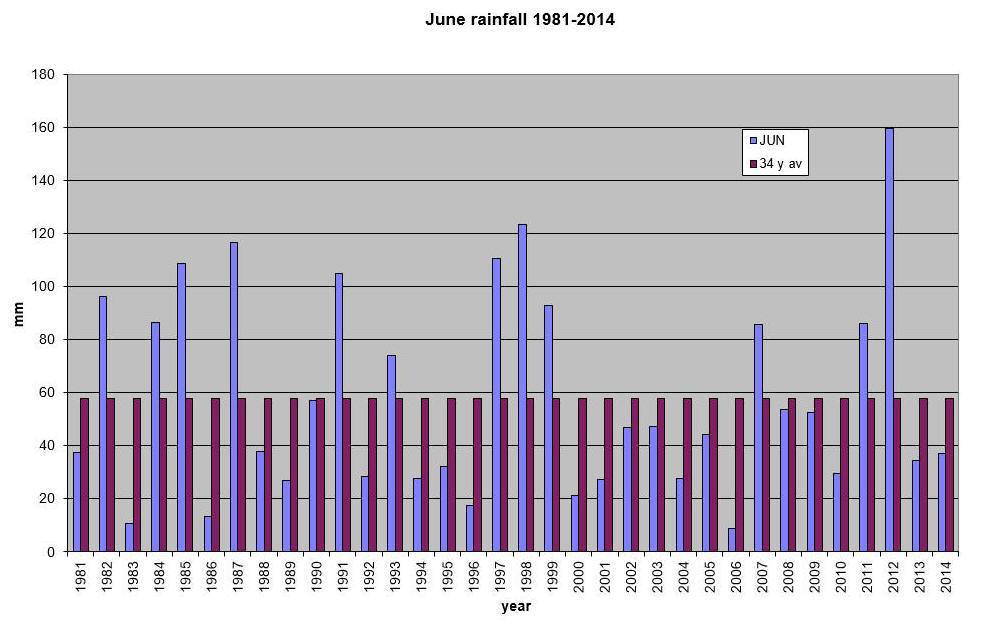
June
2014
After all the rain in May, June was a much
drier month. Statistically this should not have been a surprise as in
the last 34 years, twice as many June figures have been below average
as above it. The rain we did have most almost all as showers with the
one on the last day being particularly heavy. The first 2 weeks were
pleasantly warm with only 2 days with a maximum temperature below
20ºC, then very briefly the temperatures fell a little before
recovering again in the latter part of the third week and throughout
the last. Compared with 2013, June was just slightly warmer and less
wet. Facts and figures
June 2014
June 2013 Maximum temperature
ºC
26.0
25.0 Average max temp ºC
22.76
19.99 Days above 20ºC 26
16 Minimum temperature
ºC
7.2
6.7 Average min temp ºC
11.71
10.48 Nights below 10ºC 4 13 Rainfall mm 37.0 36.6 Days with rainfall
13
14 Average over last 34
years
mm
57.78 Years with below
average rain
22 Years with above
average rain
12 Wettest year
2012 with 159.6mm Driest year
2006
with 8.8mm Rainfall Chart
Gary Beynon May 2014May was a wet month with nearly twice the 34 year
average rainfall. It was the second wettest May in 34 years, beaten only
by 2007. There were some real contrasts through the month; a minimum
temperature of 1.3ºC and a maximum of 26.4ºC although not on the same day!
Compared with 2013 the average temperatures were higher and I suspect that
this has been reflected in the growth rates of plants and grass. The high
rainfall is reflected in the flow of the Misbourne; still going strongly
and still running from Mobwells down. It is a great shame that Fete day
was not that good but thankfully people still turned out and enjoyed
themselves. Facts and figures
May 2014
May 2013 Maximum temperature ºC
26.4
22.4 Average max temp
ºC
18.74
16.82 Days temp >15ºC
26
23 Days temp >20ºC
10
3
Minimum temperature ºC
1.3
2.8 Average min temp ºC
9.10
7.22 Days temp <10ºC
15
26 Days temp <5ºC 2
4 Rainfall
mm
105.9
78.9 Days with rain
20
21 34 year average rainfall
mm
61.23
Wettest year
2007
with 153.9mm Driest year
1990 with 2mm
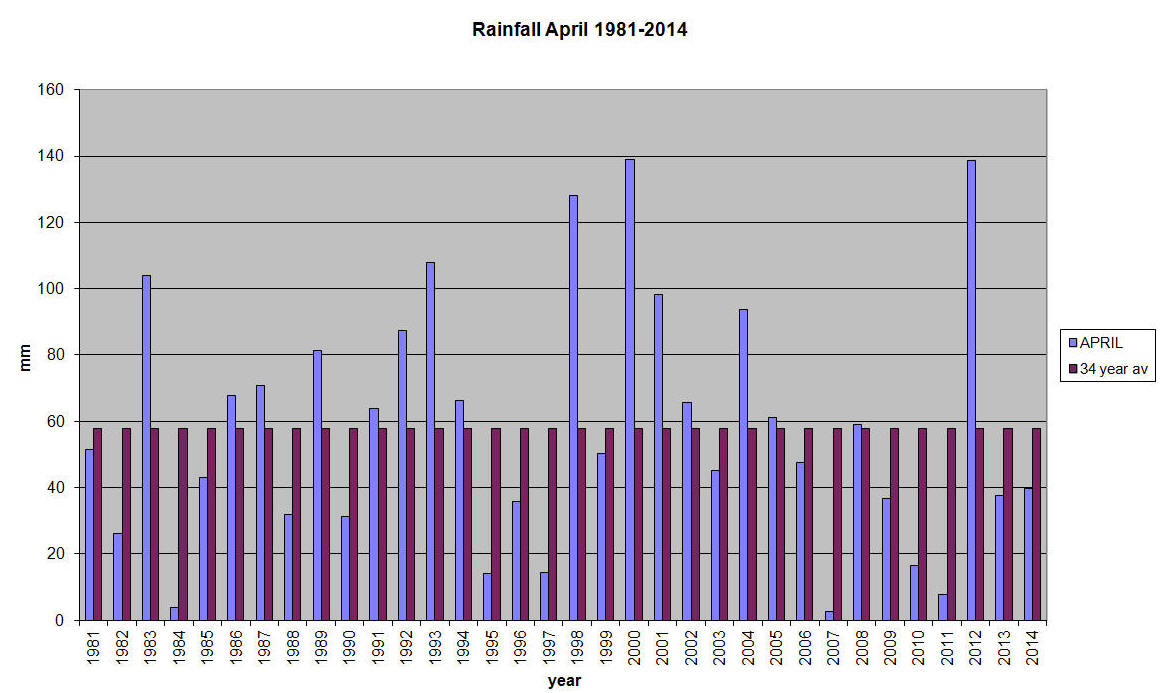
April was the second dry month this year with rainfall below average. April is a variable month with the highest rainfall at 139mm back in 2000 and the driest, only 3.7mm, in 1984. Temperatures were variable with a high of 19.8ºC and a low of 2.1ºC with just about everything between. Frost was evident on the top of the car on just 2 mornings but the old saying “ne’er cast a clout ‘till May is out” warns us that frosts are still possible this new month. As I write this the forecast is indeed for frosts early this Bank Holiday weekend. Still it did give the farmers a chance to catch up and the spring crops are now in and well up in some cases. The Misbourne is still full with water at Great Missenden but it is not running as quickly as it was. Facts and figures April 2014 April 2013 Maximum temperature ºC 19.8 21.6 Average max temp ºC 16.46 13.67 Days max temp >15 ºC 23 13 Minimum temperature ºC 2.1 -1.6 Average min temp ºC 6.79 4.01 Days min temp <5 ºC 7 18 Days with frost 2 8 Rainfall mm 39.7 37.5 34 year average rainfall mm 57.91 Days with rainfall 12 14
Gary Beynon
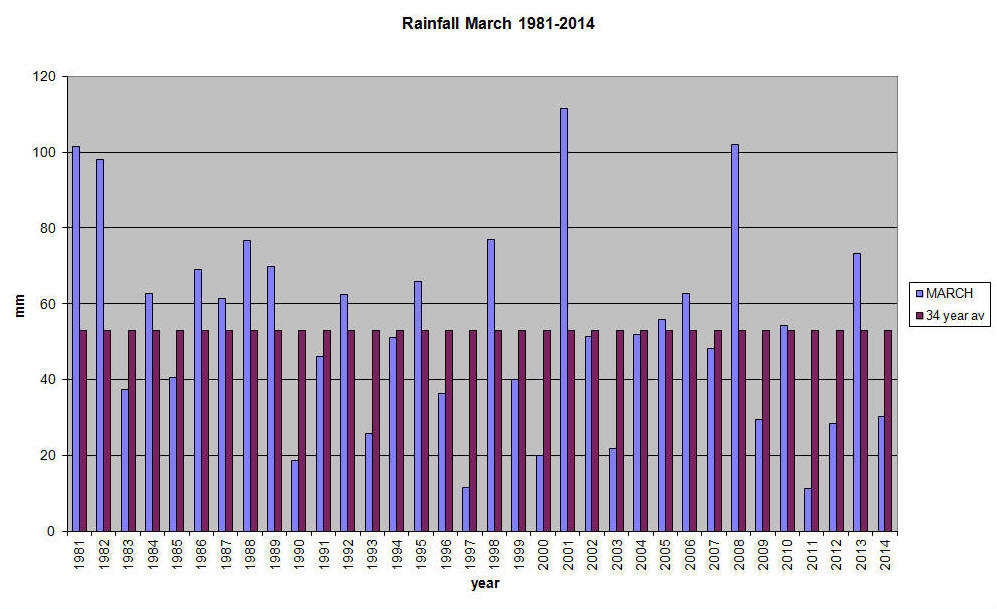
All change!! After 5 months of heavy rainfall, March turned out to be quite dry. Rainfall was well below average for the month, less than a third of the wettest March (111.5 mm 2001) and three times the driest (11.3 mm 2011). There can be little doubt that there is no pattern from year to year. It was also a mild month with temperatures often over 15ºC and, although there were ground frosts on7 mornings, there was just I day when the air temperature dropped below zero. It is clear though that ground water levels remain high with the Misbourne running from Mobwells. The dry spell allowed the farmers to cultivate and seed the ground left over the winter. Our aquifers are apparently replenished in the 6 months from October to March; this year they have had a good “drink” with virtually 50% more than the average but still below that really wet winter of 2000/1. Why then all the floods this winter? I offer no explanation! Facts and figures March 2014 March 2013 Maximum temperature ºC 19.1 13.6 Average max temp ºC 13.32 6.6 Minimum temperature ºC -0.2 -3.4 Average min temp ºC 4.18 0.64 Days max temp > 15 ºC 12 0 Days max temp <5 ºC 0 10 Days min temp < 5 ºC 18 28 Days with frost 7 19 Rainfall mm 30.3 73.3 34 year average rainfall mm 53.09 Days with rain/precipitation 13 15 Days with snow/sleet/hail 1 9
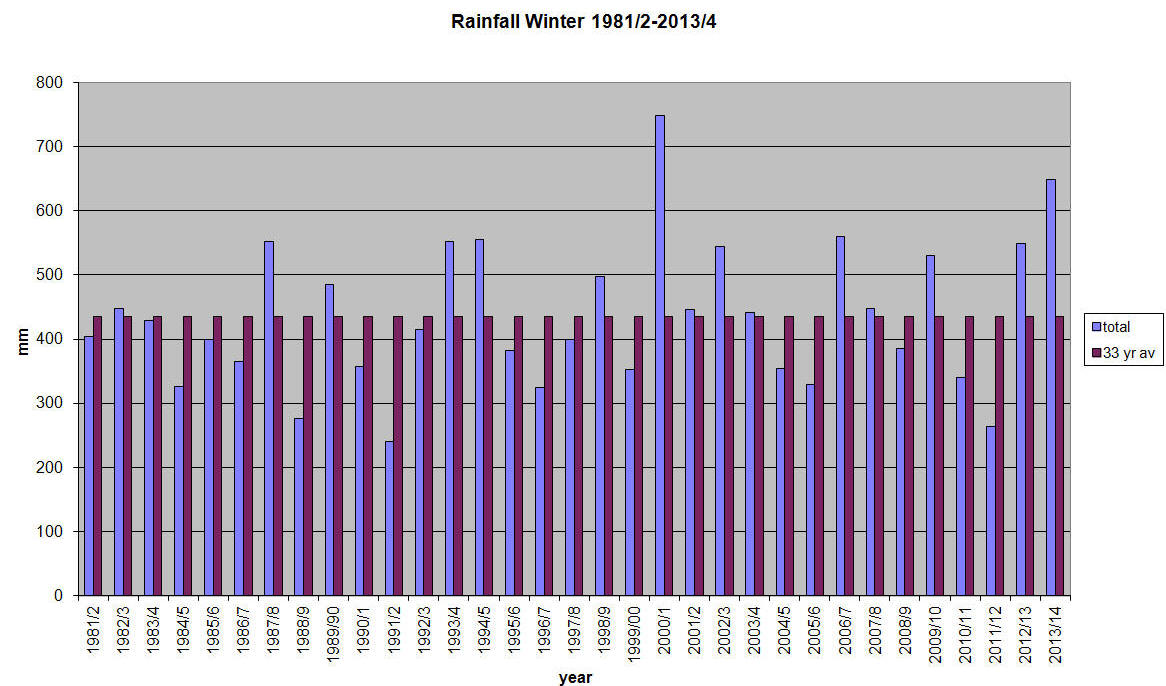
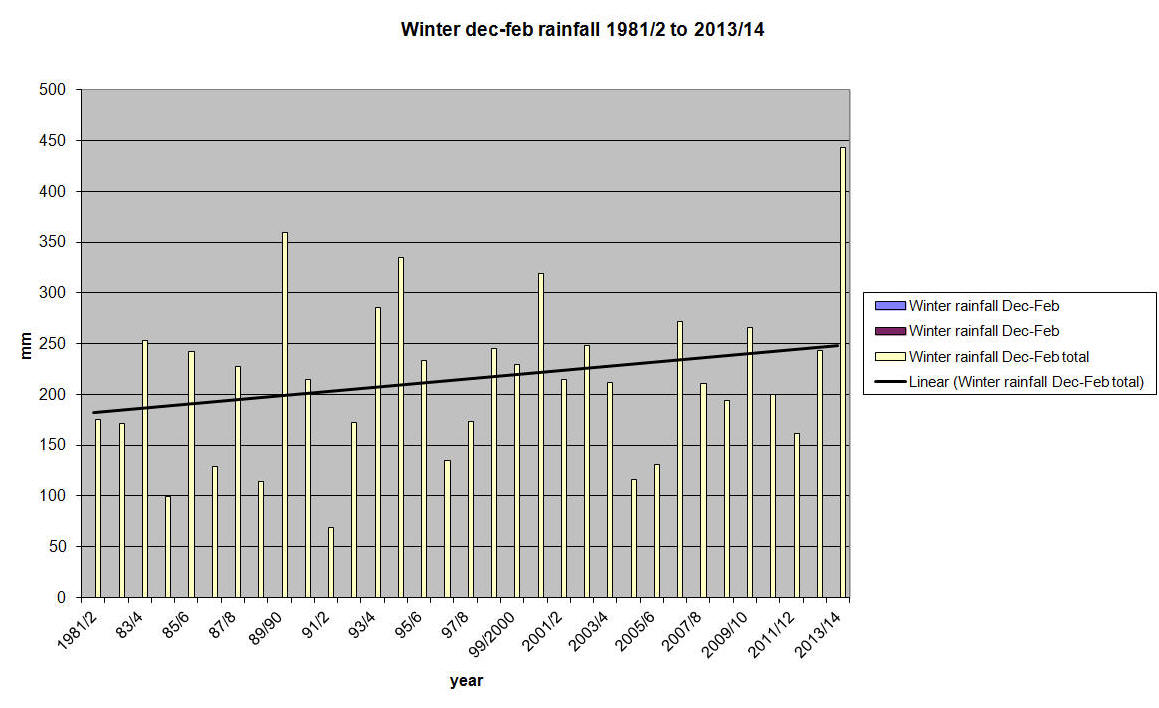
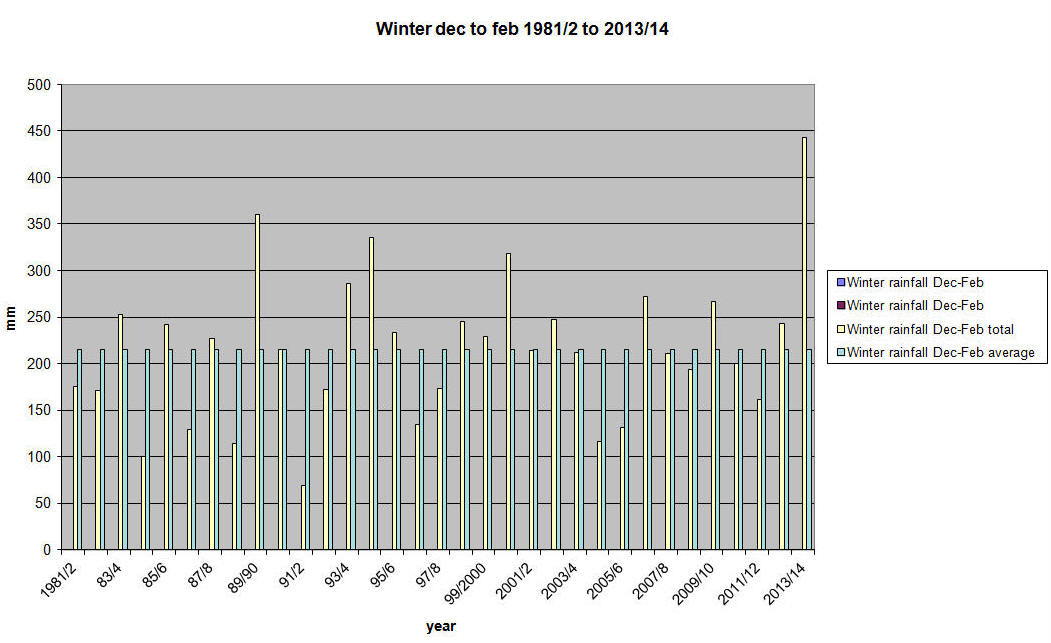
Winter rainfall mm 649.4 Average winter rainfall mm 434.7
Gary Beynon
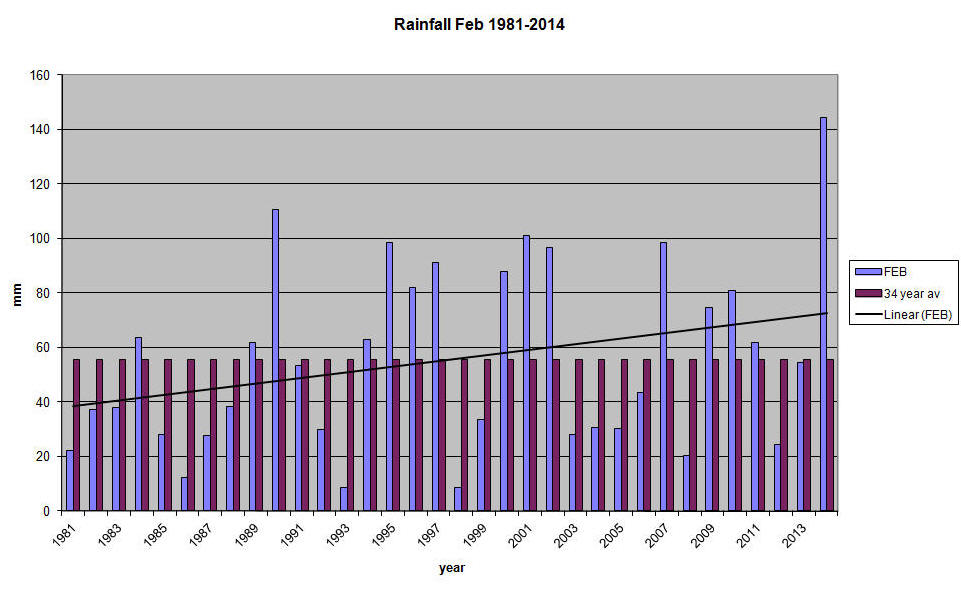
The Met Office announced that it was the wettest winter since records began-and that was before the end of February. Winter in rainfall terms is defined as the months of December to February. Hyde Heath did not buck the trend ! This is by far and away the wettest winter we have had in 33 years. The amount of rain was 443mm compared with an average of 215mm and the previous high in 1989/90 of 360mm. It has been wet but mild with no snow, very few frosts and higher than average maximum temperatures. Looking at trends and averages including this year’s figures is not that meaningful as extremes throw things out but it is going to be interesting to see how the figures carry on in the future. February as a month was also very wet with nearly 3 times the average rainfall and temperatures significantly above last year. There were very few frosts and a lot of cloud and wind. We are fortunate not to suffer the flooding of other parts of the country; an advantage of living on the top of a hill but a glance at the Misbourne it ample evidence to show how even a small river can overflow and flood land. If we are very lucky maybe the planners for HS2 (sorry to use bad language) will conclude that a tunnel under the Misbourne will merely be a different bad for it to flow in and alter the route completely or even cancel the whole project. Our farmers are now well behind as the land is so waterlogged that ploughing is not possible and the winter crops are potentially, even here, vulnerable to rotting in the ground. Will the Water Board dare to announce hosepipe bans this year ? The facts and figures February 2014 February 2013 Maximum temperature ºC 12.9 10.5 Average max temp ºC 9.09 6.0 Days max temp > 5ºC 28 15 Days max temp >10ºC 10 2 Minimum temperature ºC 1.3 -1.4 Average min temp ºC 3.31 0.98 Days min temp < 0ºC 0 6 Days with frost (on car roofs) 4 16 Days with snow/sleet 0 8 Rainfall mm 144.5 54.6 Rainfall 34 yr average for Feb 55.5 Wettest day in Feb mm 34.5 27.2 Winter rainfall (Dec to Feb) mm 2013/14 443 Average over 33 years 215 Previous wettest winter 1989/90 360 Rainfall charts
Gary Beynon
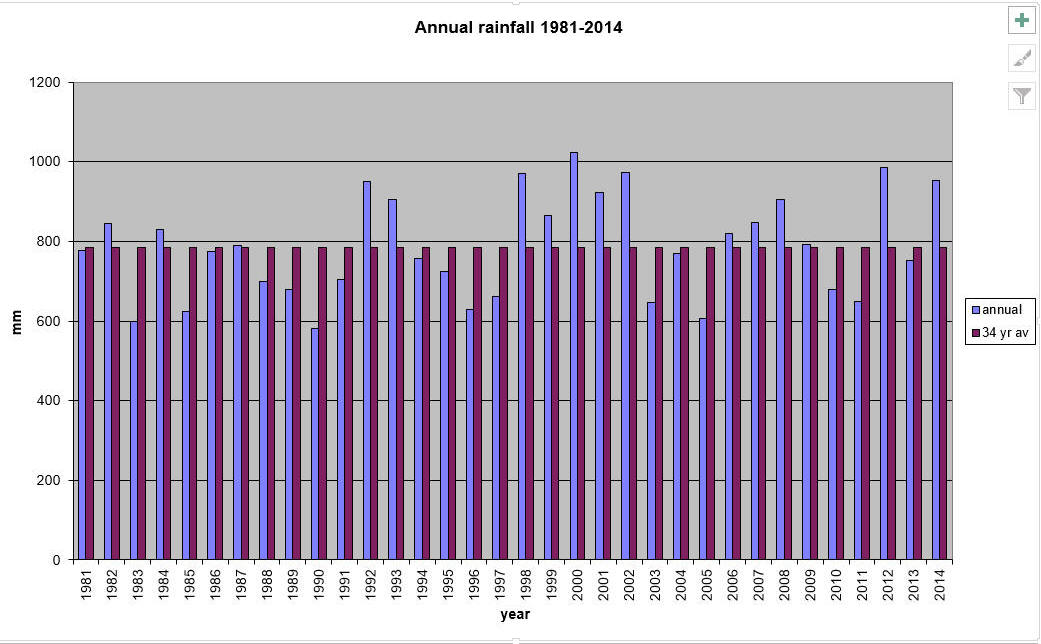
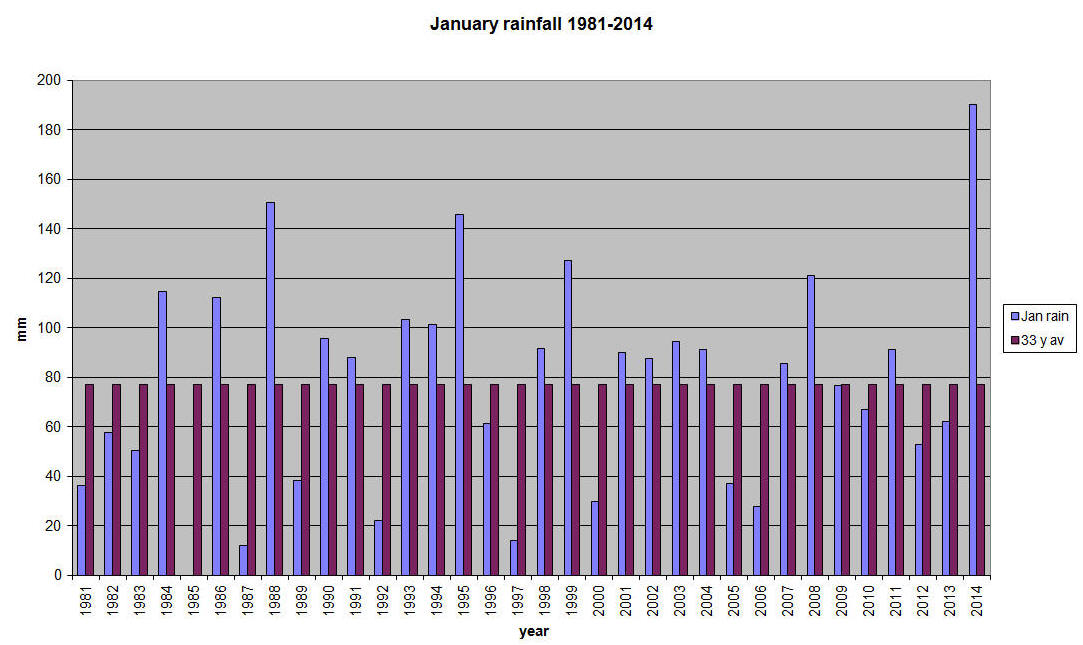
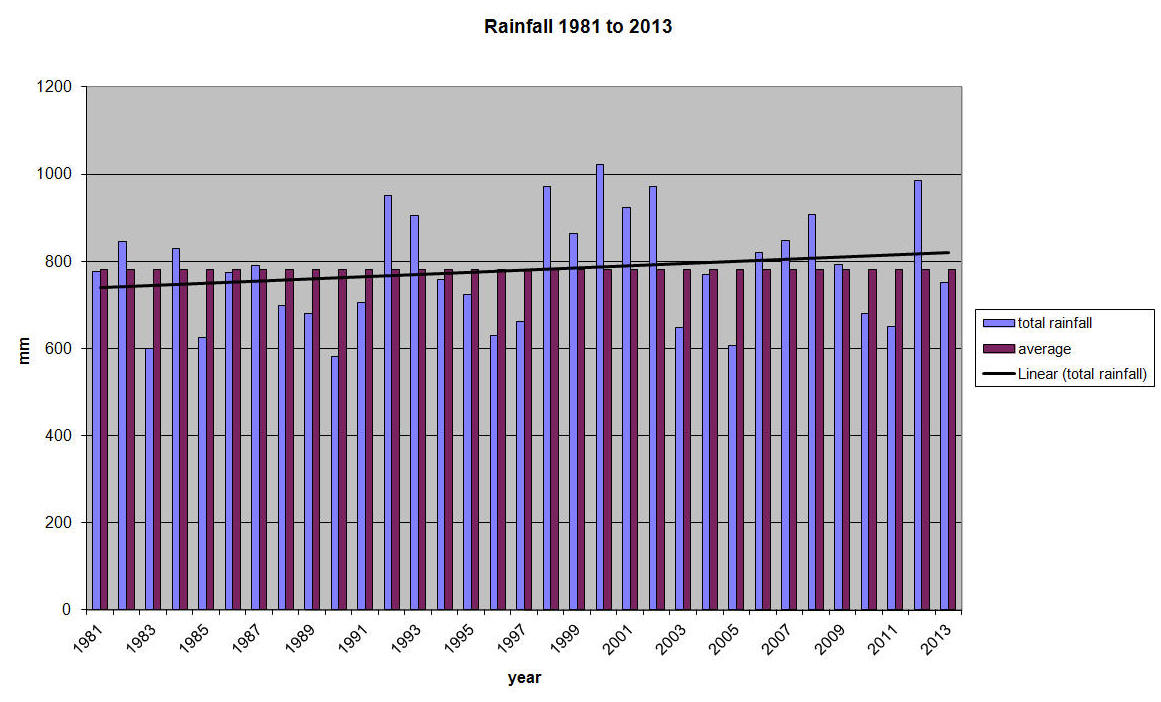
January was the wettest January in the last 34 years but I suspect you already knew that. It was also the second wettest month in the last 34 years; the wettest being October 1987—by a mere 0.3mm. Rainfall was nearly 3 times the 34 year average for the month. Although it was wet, it was also a mild month with no really hard frosts and some high maximum temperatures. Fortunately there was no snow unlike January last year. The wettest day was on the 31st when some 18.5 mm fell; this however was not a lot compared with the 6th of February but you will need to wait until that report to see what the downpour measured! There was rain on virtually every day in the month with cloud being predominant. The total rainfall for 2013 was 751.5mm, close to average but as you will see from the graph, some wide variations from year to year. Facts and figures January 2014 January 2013 Maximum temperature ºC 11.5 12.9 Average max temp ºC 8.64 4.67 Days max temp > 10ºC 6 8 Minimum temperature ºC -0.4 -5.5 Average min temp ºC 3.27 1.9 Days min temp < 0ºC 2 13 Days frost evident 6 16 Days with snow 0 7 Rainfall mm 190.1 62 34 year average rainfall 77.2 Days with rain etc 28 19
Gary Beynon
|
|||||