 |
Hyde Heath Weather 2016 |
 |

|
|
|
|||||||||||
| Home | |||||||||||
| Weather 2008/9 | Weather 2010 | Weather 2011 | Weather 2012 | Weather 2013 | Weather 2014 | ||||||
| Weather 2015 | |||||||||||
|
Hyde Heath weather reports by Gary Beynon based on his own observations & measurements | |||||||||||
| January | February | March | April | May | June | ||||||
| July | August | September | October | November | December | ||||||
|
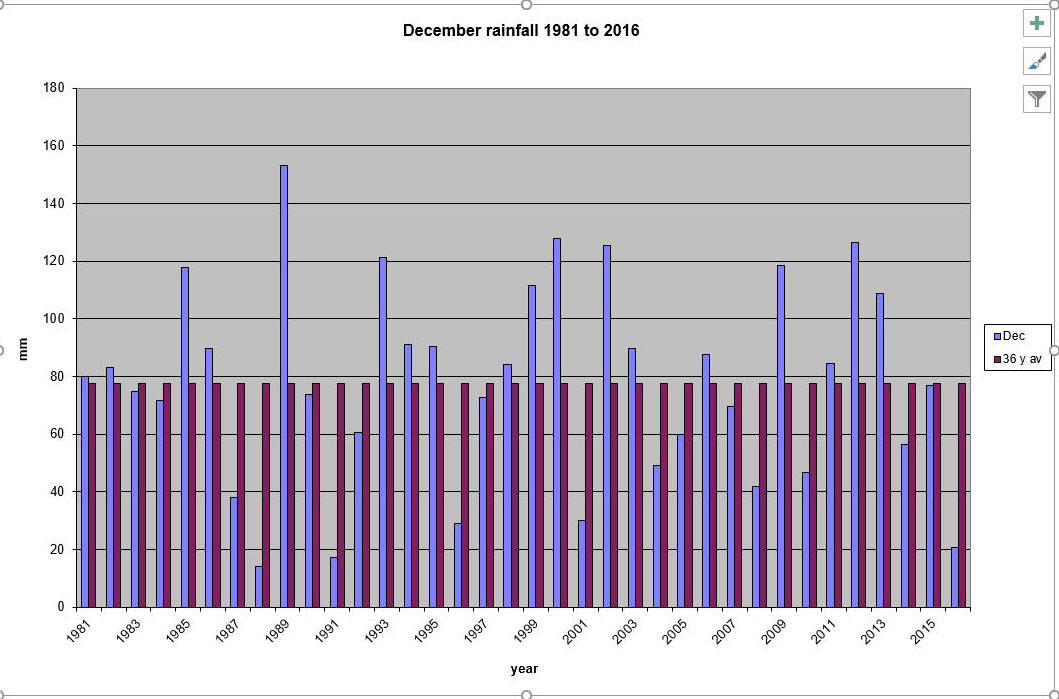
December was a dry month with rainfall way below average even though there was some precipitation, albeit very little, on 16 days. It was also “mild” with a high of 13.2ºC and an average temperature of 8.90ºC during the day. By December there would normally be a number of “scrape the windscreen“ days; there were only 6 and 4 of these were at the end of the month. There was a brief period of rather high pressure when it reached 1035 mm Hg, the highest in 2016. 11 days were recorded as mostly sunny. There were a lot of changes; one day sunny, the next cloudy, the next misty, then sunny with a frost; kept everyone guessing. However, compared with December 2015, this year was not as mild but it was drier.
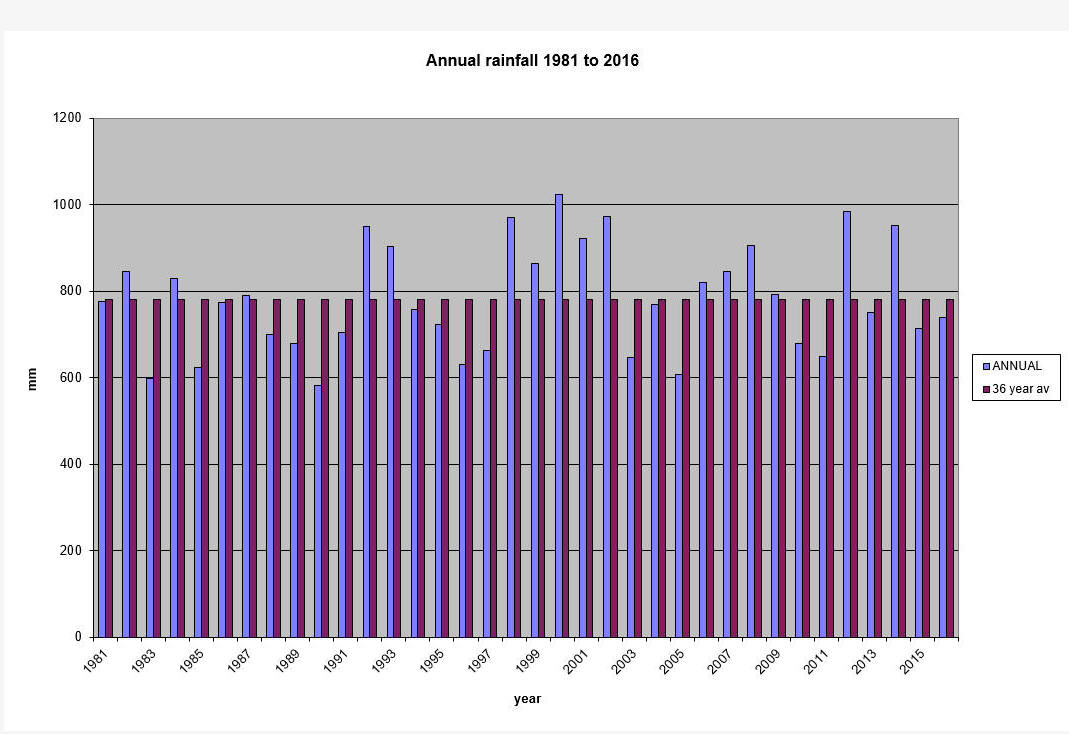
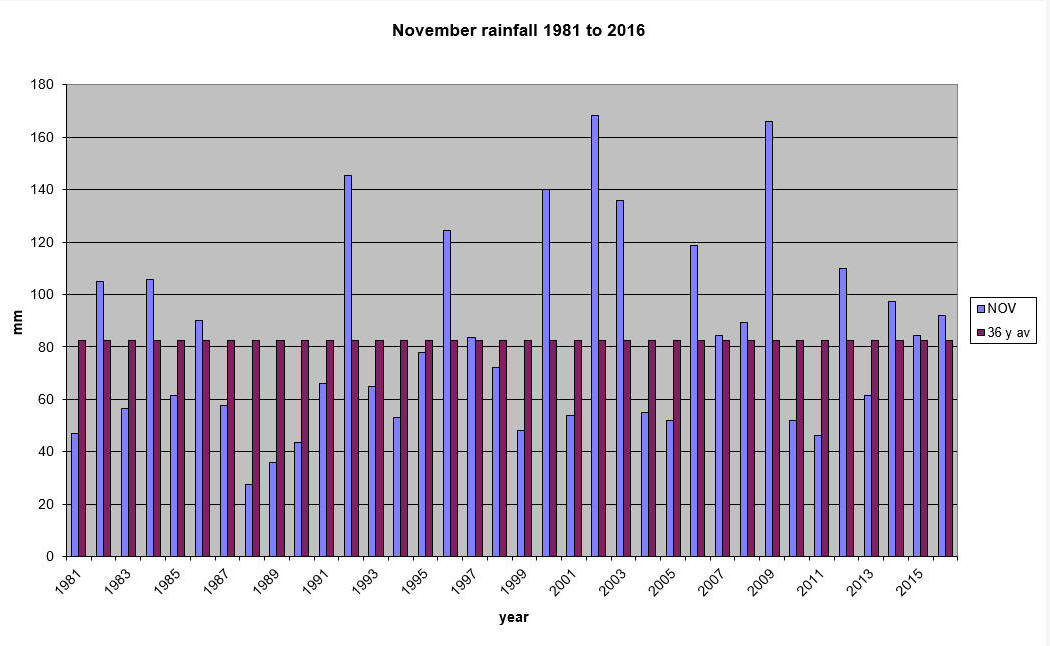
2016 year The rainfall chart for 2016 is shown; not far off the average for the past 36 years.
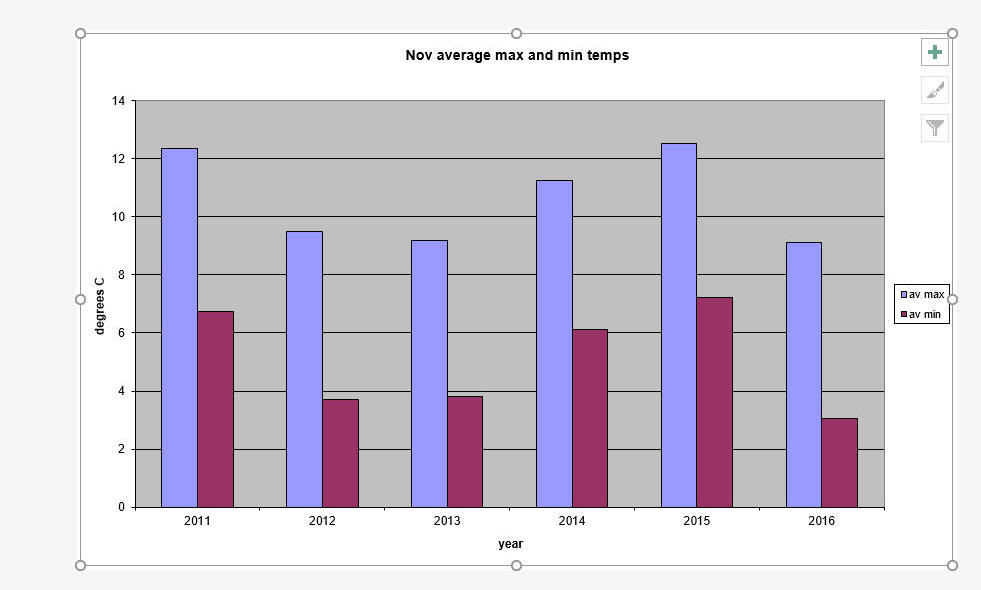
November Something of a mixture as far as the weather was concerned. Cold start, cold finish and a wet middle, so a sandwich! The rainfall was quite intense on a number of days with the 8th seeing 21.6mm and the 4 days from 19th to 22nd recording 45.3mm so we actually had some two thirds of the total rainfall in just 5 days. We were fortunate in that there was no flooding unlike some parts of the country; the ground here sucked up the rain like a sponge. Rainfall was close to the 36 year average but, as you will see from the chart, variations year on year are substantial; not a month that one could predict! There is a great deal said about global warming and this might mean cooler temperatures in some parts of the world whereas others will find increases. I have inserted a chart looking at the average maximum and minimum temperatures in November over the last 6 years---conclusion no pattern. Read into that what you like. Maybe we only remember the extremes of weather that we have had but I do (seem) to recall colder Novembers than we have now. The good thing is that winter is held off just a little longer.
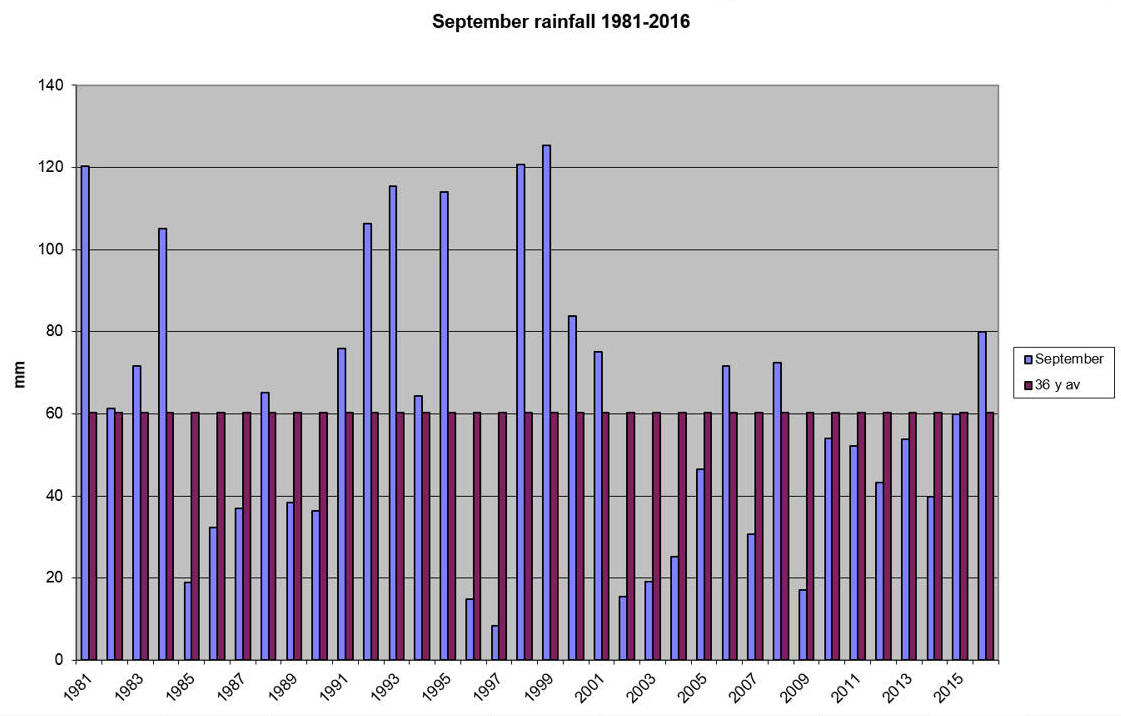
  Gary Beynon Top of page Home December 6th 2016 October A summary for October would be warm, often sunny, dry and not autumnal. Actually very similar to October last year and perhaps what we are coming to expect as our seasons become less extreme. It was a dry month with rainfall way below average but if you look at the graph you will see just how variable the rainfall has been across the past 36 years. Yet again the leaves “stuck” to the trees and exhibited some remarkable colours. Apparently the mild Spring and combination of weather meant that the leaves produced more chlorophyll than usual and this led to the Autumnal colours. There were no frosts and the there were 13 days when it was mostly sunny. The ground remained very dry. The great advantage of a mild October is that Winter is not hastened on!  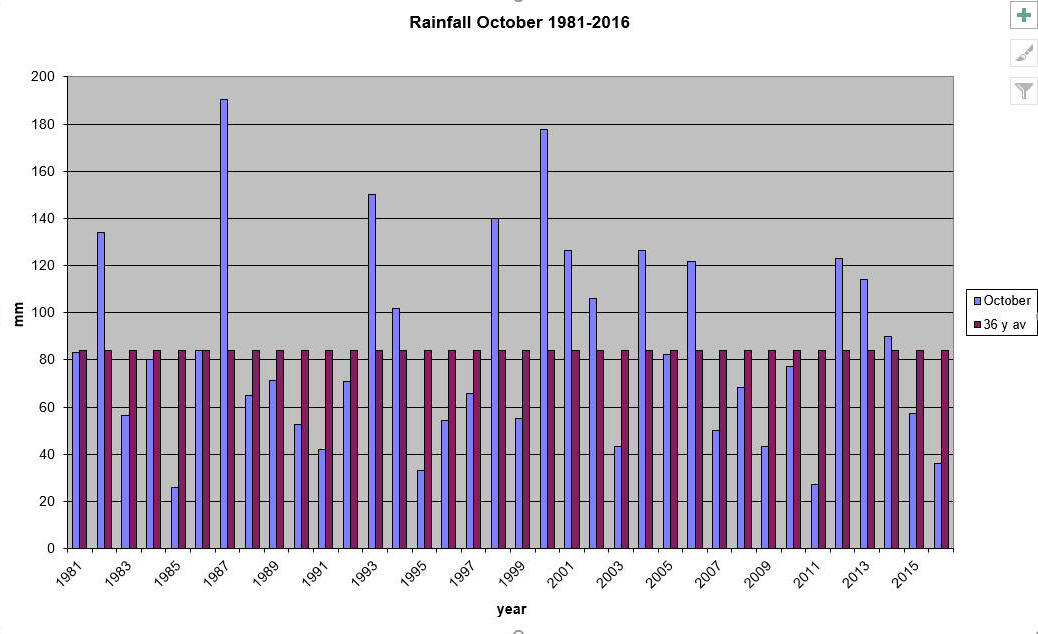 Gary Beynon Top of page Home November 12th 2016 September September was a warm month comparatively speaking although the number of days when it was predominately sunny was only 11. Tuesday 13th was one of the warmest September days on record at 27.4º and 2 days later Hyde Heath had 41.9mm of rain between about 5 am and 7.30 am---which is a lot! The night time temperatures kept up with only 8 days with a minimum less than 10º.With over 50% of the rainfall coming in just a few hours, the ground remained hard despite having some sort of rainfall on a total of 19 days. It was a much better month than September 2015 being warmer, sunnier and, apart from the 1 day, drier.
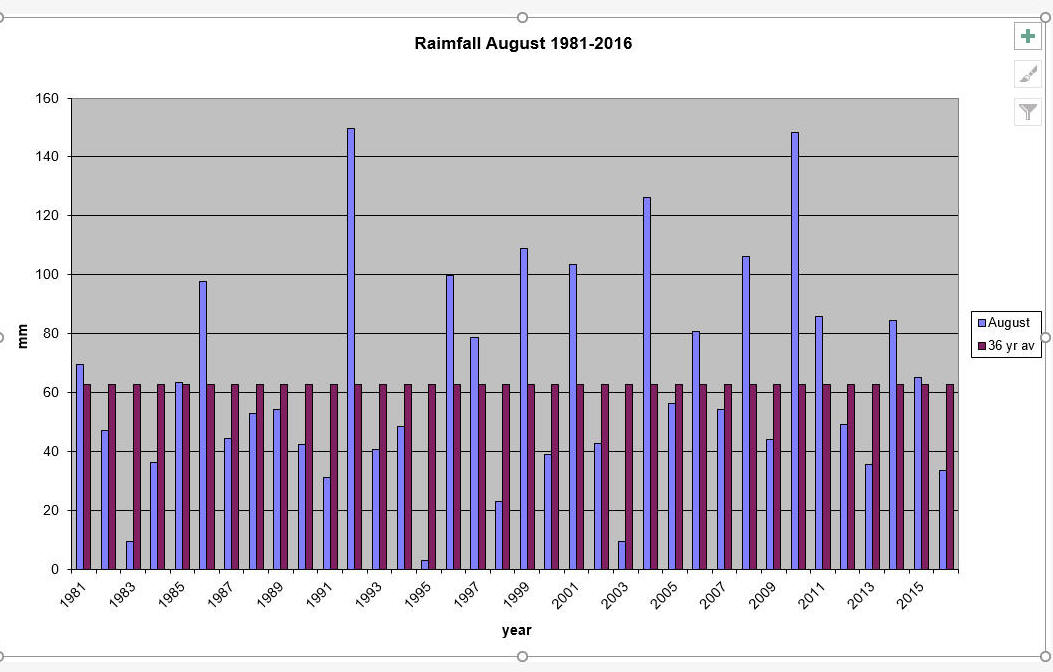
August August was a dry and warm month with 12 days of virtually unbroken sun. The rainfall came on 14 days but the majority was concentrated in just 5 days accounting for 31.9 mm of the 33.6 mm total. It will go down as a really pleasant month. Certainly the farmers must have been pleased as most of the harvest is in and much of the land has already been cultivated ready for the winter sowing. Compared with August in 2015, the temperatures were higher, the rainfall was lower and overall a better year in 2016. Rainfall was a long way below the wettest August in 1992 with 149 mm but above the minimum of 9.4 mm in 2003.
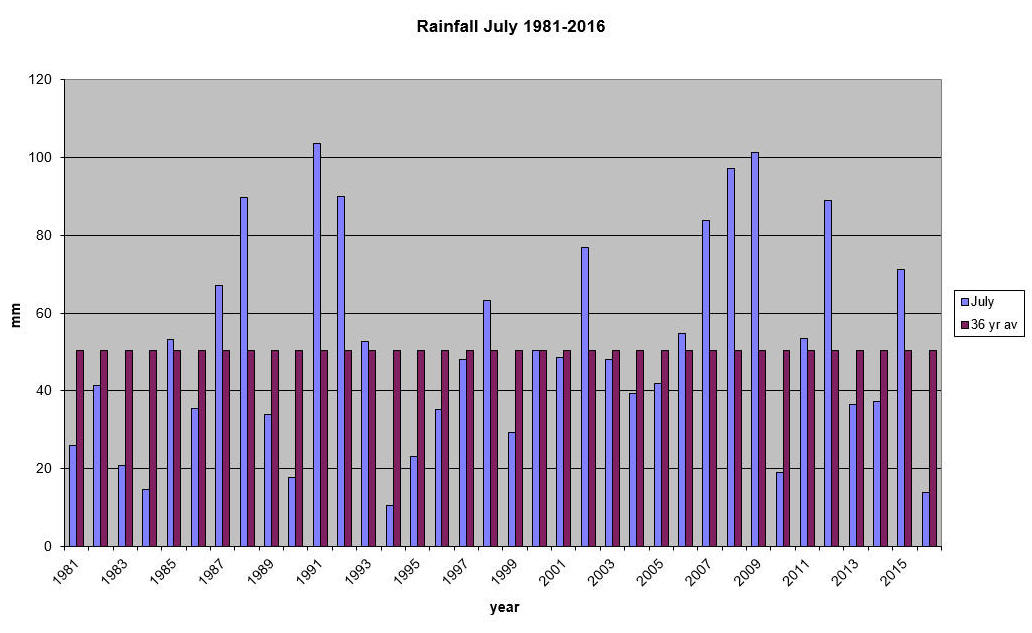
July The middle of the month saw temperatures above 30º every day with sun, no cloud and no rain; the only problem was that was Cyprus and not Hyde Heath. What of Hyde Heath----a dry month with well below average rainfall (as I write this there was more rain on 2nd August than the whole of July), average temperatures above average and minimi about on track. The start and end of the month saw a great deal of cloud but very little rain. I hear that the weather did get better while we were away with one day when the maximum was over 30ºC and there was sunshine. So far this year has not been that spectacular as far as sun and warm is concerned but we can hope for August.
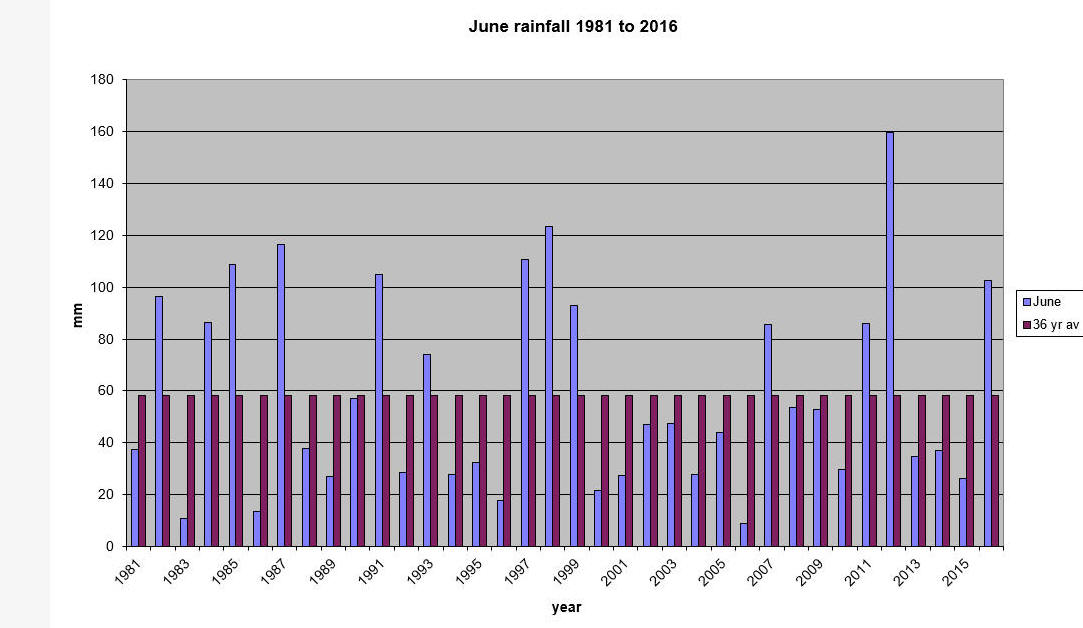
June There is an expression “flaming June”; nothing could have been further from that this year. June has been miserable with many days being overcast, only 5 days when it was predominantly sunny and a rainfall that was nearly twice the average over the past 36 years. There were 23 days when there was some rainfall with 6 days when rain was very heavy. On the face of it, temperatures were not that dissimilar from June 2015; means were very close for both maximum and minimum, although the highest this year was some 4 degrees below a really high 29.8 in 2015. So far not a good summer and as I write this at the start of July things do not look that promising!
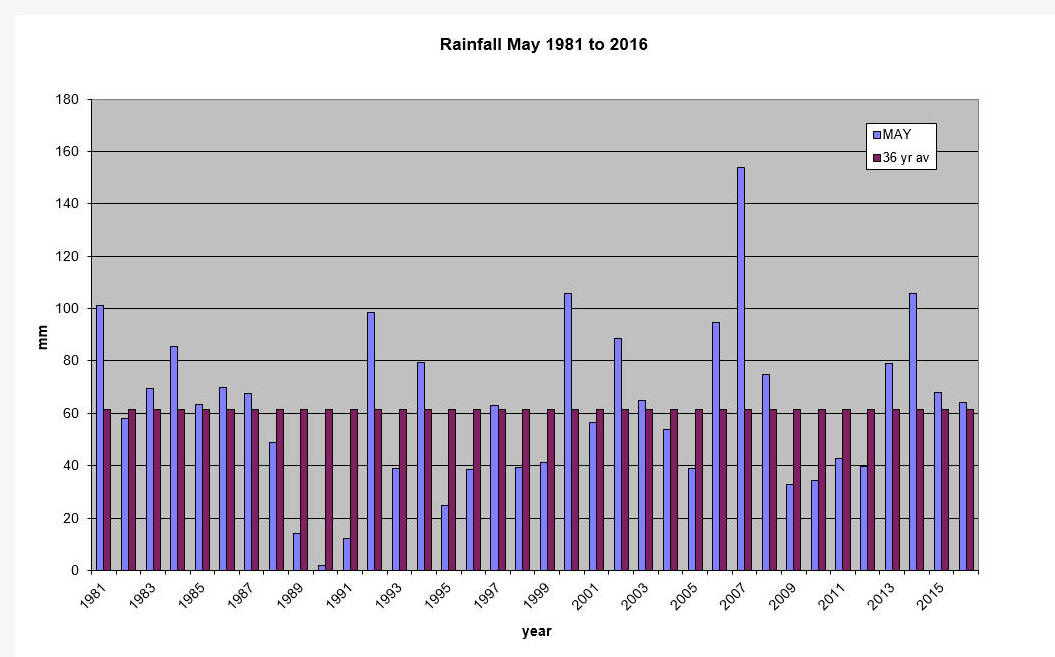
 Gary Beynon Top of page Home July 5th 2016 May May started with promise; first 8 days were mostly sunny, very little rain and temperatures in the low to mid 20s. There were then 3 days of rain then a few days of drier, warmer weather, followed by a real mixture culminating in a wet and cold miserable day on the 31st. Fête day was OK (weather wise) and pretty good as far as the fête was concerned; a bonus. Overall the month was warmer than last May and about the same for rainfall and this was very much close to the 36 year average. “They” keep promising a good summer; on this 1st June things will need to perk up somewhat!
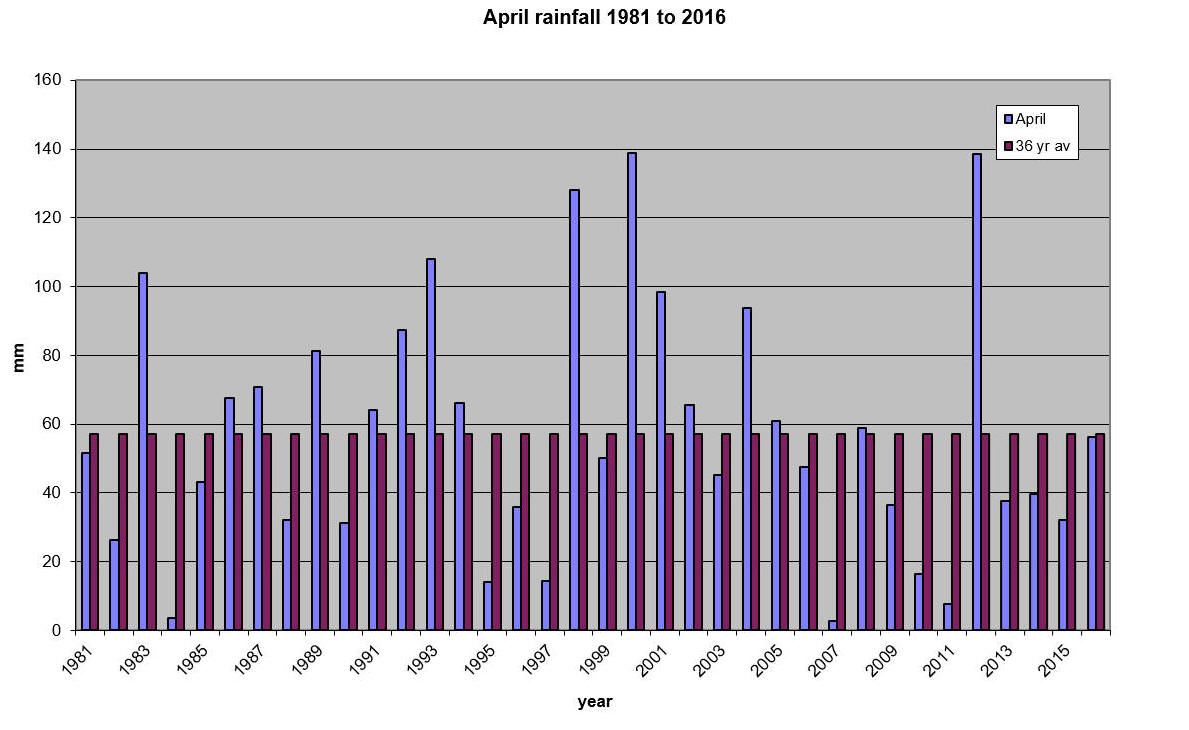
 Gary Beynon Top of page Home June 1st 2016 April The month could have felt reasonably warm but there was a persistent wind from a northerly direction that made it feel cooler. Added to this was the number of days when we had some sort of precipitation-rain, sleet or hail-making it an April of some variety. Compared with last year the month was a good deal wetter with nearly average rainfall. April 2015 was dry with 50% of the rain falling on just one day. Although the thermometer did not fall below freezing, we did have frost on the cars on 9 mornings. As we move into May, at last we seem to be getting higher temperatures and with little rainfall over the end of April and start of May, the ground is drying out well. May it remain so at least until the Fête is over !
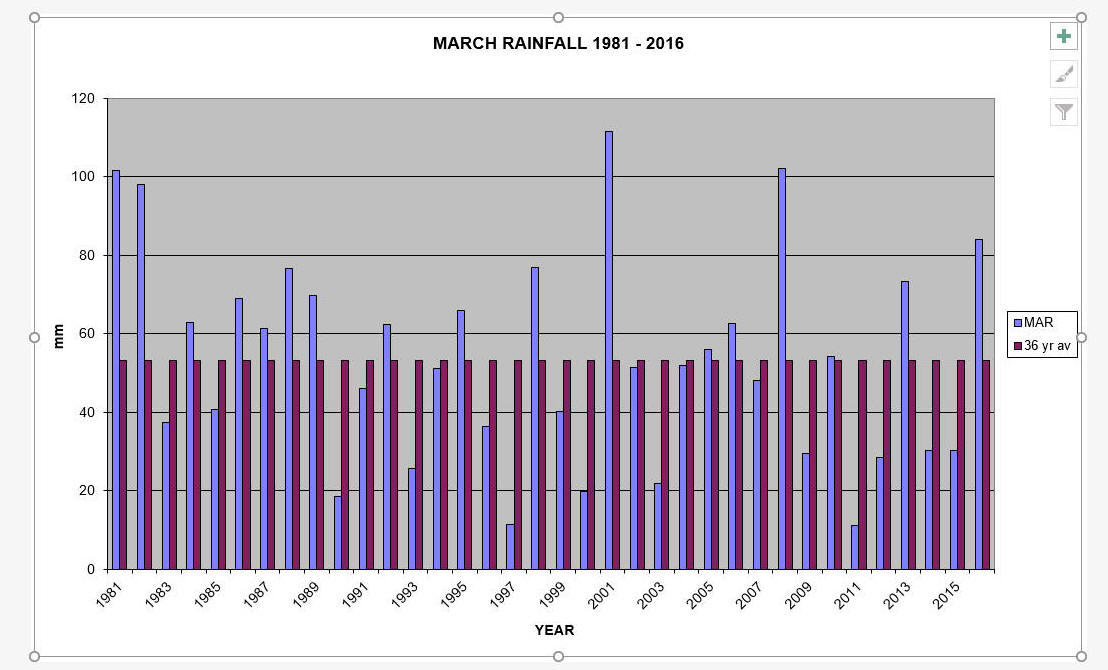
March had little to remember it by that was
good. Storm Katie hit but we were fortunate here that the effects
were not as bad as maybe had been predicted. The rainfall associated
with the storm was high at 19.3mm but the wind did not cause the
damage it could have. The month was rather wet with some amount of
rain on 17 days with over half the month’s rainfall on just two
days. It was one of the wetter months of March in the last 36 years.
Temperatures were reasonable with none of the late winters that we
used to have. 4 days saw snow, sleet or hail; something of a mixture
and 10 mornings saw a touch at least of frost. Compared with 2015,
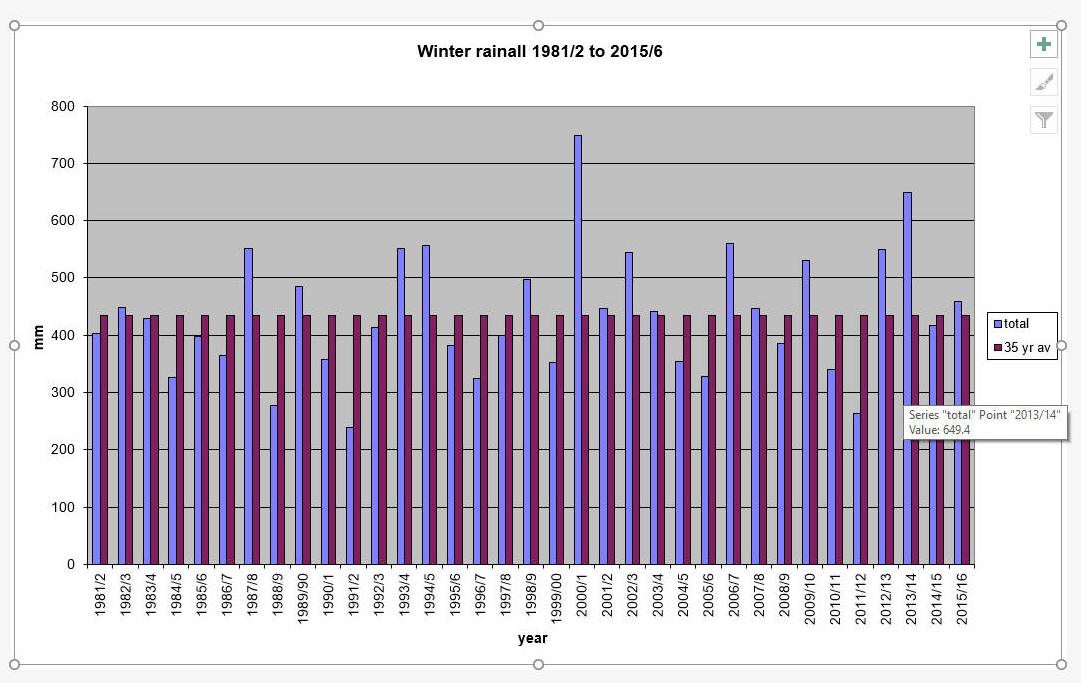
the month was very similar temperature wise but considerably wetter. The “winter” rainfall-October last year to
March this- was just about average so the water table should have
been well replenished. However, if you look at the lake by the
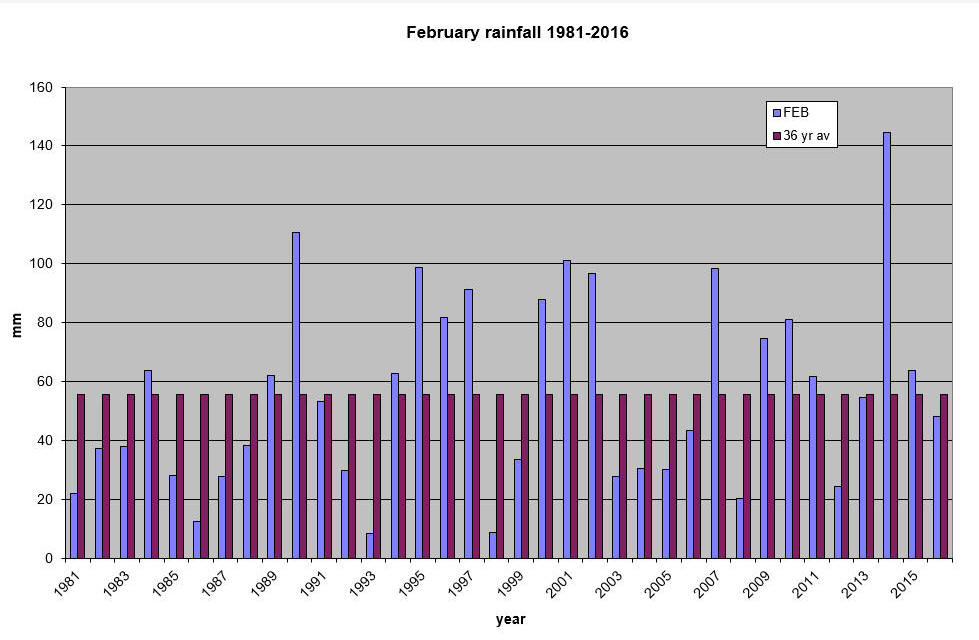
February was a dull, rather uninspiring month
with nothing that really stood out. It was not particularly wet but the
frequency of days with some rain ensured that the ground never really
dried out. The 2 days when there was about a third of an inch (8-9mm) of
rain saw the puddles appear very quickly and quite a deal of run off
from the fields. Temperatures were—yet again—on the mild side for the
time of the year with a high of 13.9ºC but also signs of frost on 11
mornings. DRIER THAN February last yearand temperatures slightly lower.
|
|||||||||||
|
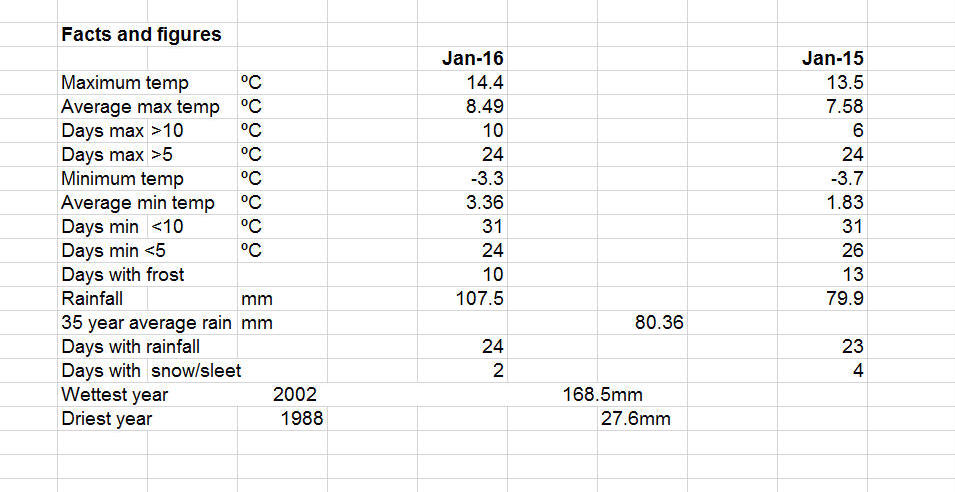
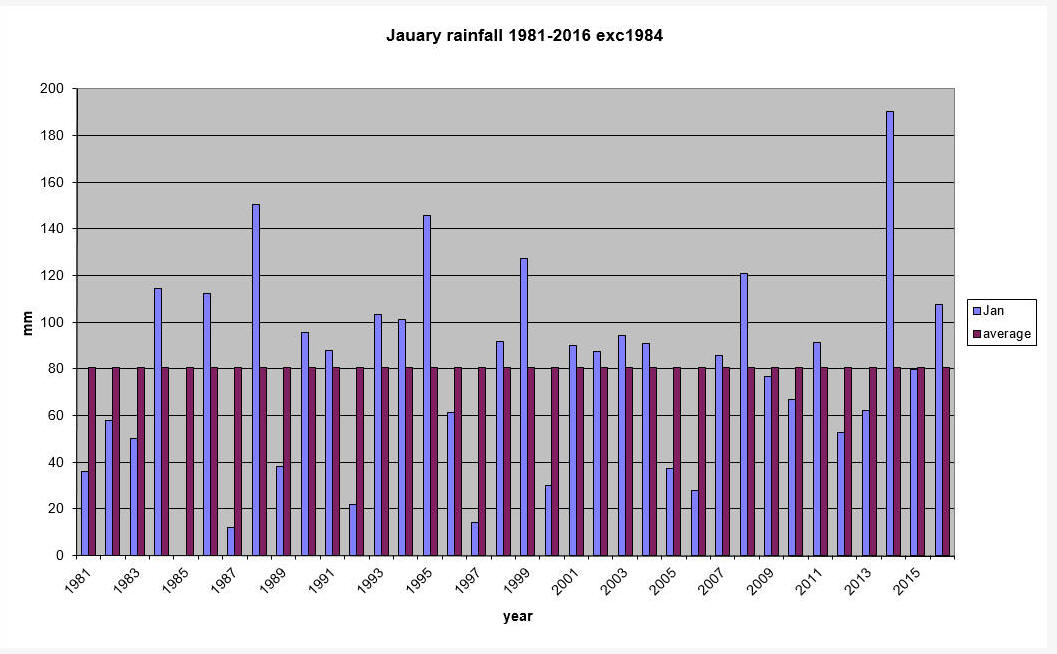
This January was mild and wet. It was quite similar to January
2015 and not like the January weather that we might expect. There was
snow/sleet but fortunately it did not amount to much (2.5cm) and was
gone within a day. We had noticeable frosts on 10 days with a low of
-3.3ºC. Wind was a feature on just 2 days in some contrast to places
further north who caught the brunt of the numerous storms that swept in
from the |
|||||||||||
 |
|||||||||||
 |
|||||||||||
| Gary Beynon | |||||||||||
| Jan 9th 2016 Top of Page Home | |||||||||||